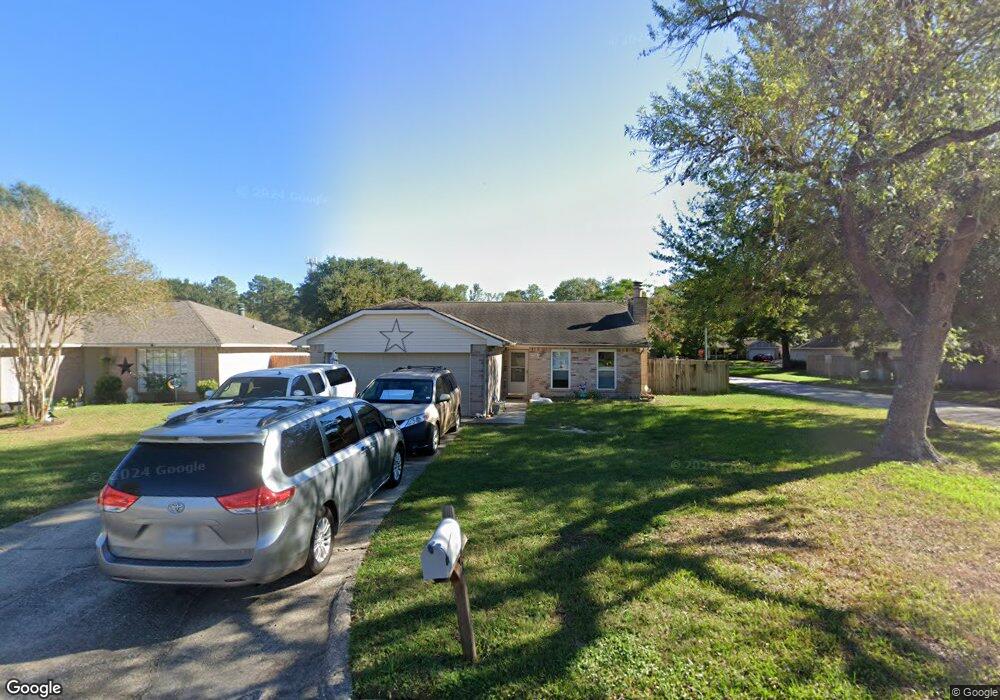
4602 Quailgate Dr Spring, TX 77373
Estimated Value: $194,470 - $206,000
3
Beds
2
Baths
1,280
Sq Ft
$157/Sq Ft
Est. Value
About This Home
This home is located at 4602 Quailgate Dr, Spring, TX 77373 and is currently estimated at $200,618, approximately $156 per square foot. 4602 Quailgate Dr is a home located in Harris County with nearby schools including Mildred Jenkins Elementary School, Dueitt Middle School, and Spring High School.
Ownership History
Date
Name
Owned For
Owner Type
Purchase Details
Closed on
Sep 25, 2014
Sold by
Pierce Robert Mark
Bought by
Roberts Karyn and Roberts Skipper
Current Estimated Value
Home Financials for this Owner
Home Financials are based on the most recent Mortgage that was taken out on this home.
Original Mortgage
$87,400
Outstanding Balance
$66,910
Interest Rate
4.14%
Mortgage Type
New Conventional
Estimated Equity
$133,708
Purchase Details
Closed on
Aug 18, 2006
Sold by
Sankey Valerie and Sankey Valerie L
Bought by
Pierce Robert Mark
Home Financials for this Owner
Home Financials are based on the most recent Mortgage that was taken out on this home.
Original Mortgage
$61,480
Interest Rate
6.77%
Mortgage Type
Purchase Money Mortgage
Create a Home Valuation Report for This Property
The Home Valuation Report is an in-depth analysis detailing your home's value as well as a comparison with similar homes in the area
Home Values in the Area
Average Home Value in this Area
Purchase History
| Date | Buyer | Sale Price | Title Company |
|---|---|---|---|
| Roberts Karyn | -- | Alamo Title Co | |
| Pierce Robert Mark | -- | Startex 07 Title Company |
Source: Public Records
Mortgage History
| Date | Status | Borrower | Loan Amount |
|---|---|---|---|
| Open | Roberts Karyn | $87,400 | |
| Previous Owner | Pierce Robert Mark | $61,480 |
Source: Public Records
Tax History Compared to Growth
Tax History
| Year | Tax Paid | Tax Assessment Tax Assessment Total Assessment is a certain percentage of the fair market value that is determined by local assessors to be the total taxable value of land and additions on the property. | Land | Improvement |
|---|---|---|---|---|
| 2025 | $3,063 | $173,777 | $38,569 | $135,208 |
| 2024 | $3,063 | $176,109 | $38,569 | $137,540 |
| 2023 | $3,063 | $189,528 | $38,569 | $150,959 |
| 2022 | $3,686 | $172,191 | $15,428 | $156,763 |
| 2021 | $3,550 | $136,181 | $15,428 | $120,753 |
| 2020 | $3,575 | $128,432 | $15,428 | $113,004 |
| 2019 | $3,488 | $120,890 | $9,874 | $111,016 |
| 2018 | $2,574 | $110,246 | $9,874 | $100,372 |
| 2017 | $2,975 | $110,246 | $9,874 | $100,372 |
| 2016 | $2,705 | $94,803 | $9,874 | $84,929 |
| 2015 | $2,174 | $94,803 | $9,874 | $84,929 |
| 2014 | $2,174 | $75,000 | $9,874 | $65,126 |
Source: Public Records
Map
Nearby Homes
- 23815 Firegate Dr
- 4407 Quailgate Dr
- 4423 Mossygate Dr
- 23911 Lestergate Dr
- 4815 Hickorygate Dr
- 24003 Lestergate Dr
- 24031 Holleygate Ct
- 23602 Wintergate Dr
- 4827 Tealgate Dr
- 4523 Bridgevillage Dr
- 23615 Lady Capulet Dr
- 4907 Tealgate Dr
- 4803 Blue Jacaranda Way
- 4919 Tealgate Dr
- 4822 Edgegate Dr
- 4318 Burkegate Dr
- 4422 Enchantedgate Dr
- 4831 Blue Jacaranda Way
- 4247 Rosegate Dr
- 4311 Enchantedgate Dr
- 4606 Quailgate Dr
- 4603 Hickorygate Dr
- 4610 Quailgate Dr
- 4607 Hickorygate Dr
- 4611 Hickorygate Dr
- 4603 Quailgate Dr
- 4531 Hickorygate Dr
- 4614 Quailgate Dr
- 4607 Quailgate Dr
- 4526 Quailgate Dr
- 4615 Hickorygate Dr
- 4611 Quailgate Dr
- 4531 Quailgate Dr
- 4527 Hickorygate Dr
- 4618 Quailgate Dr
- 4522 Quailgate Dr
- 4615 Quailgate Dr
- 4527 Quailgate Dr
- 4619 Hickorygate Dr
- 4523 Hickorygate Dr