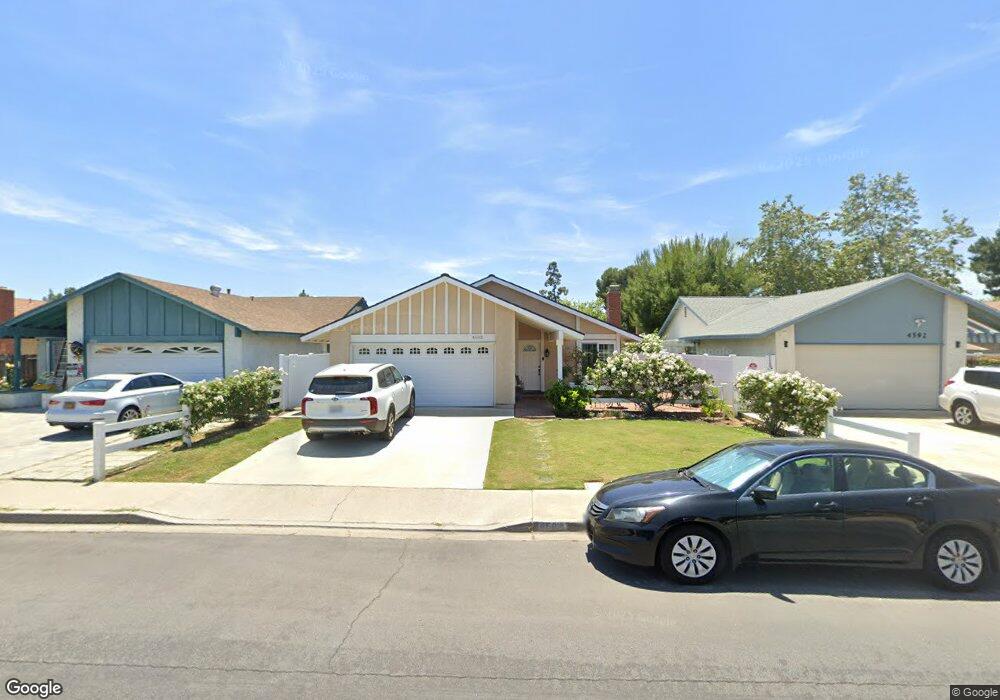
4602 Ranchgrove Dr Irvine, CA 92604
Walnut NeighborhoodEstimated Value: $1,137,000 - $1,341,000
3
Beds
2
Baths
1,116
Sq Ft
$1,119/Sq Ft
Est. Value
About This Home
This home is located at 4602 Ranchgrove Dr, Irvine, CA 92604 and is currently estimated at $1,248,302, approximately $1,118 per square foot. 4602 Ranchgrove Dr is a home located in Orange County with nearby schools including Greentree Elementary School, Venado Middle School, and Irvine High School.
Ownership History
Date
Name
Owned For
Owner Type
Purchase Details
Closed on
Mar 28, 2024
Sold by
Curran Gavin Hugh and Curran Anna Marie
Bought by
Curran Family Trust and Curran
Current Estimated Value
Purchase Details
Closed on
May 25, 2004
Sold by
Duncan Ross M
Bought by
Curran Gavin and Curran Anna
Home Financials for this Owner
Home Financials are based on the most recent Mortgage that was taken out on this home.
Original Mortgage
$494,100
Interest Rate
5.45%
Mortgage Type
Purchase Money Mortgage
Purchase Details
Closed on
Sep 2, 1998
Sold by
Lam Banh Lisa and Lam Hoa V
Bought by
Duncan Ross M and Duncan Kristine L
Home Financials for this Owner
Home Financials are based on the most recent Mortgage that was taken out on this home.
Original Mortgage
$157,600
Interest Rate
6.88%
Create a Home Valuation Report for This Property
The Home Valuation Report is an in-depth analysis detailing your home's value as well as a comparison with similar homes in the area
Home Values in the Area
Average Home Value in this Area
Purchase History
We collect this data history from publicly available records. To have your information removed, we recommend requesting removal directly through your county’s website.
| Date | Buyer | Sale Price | Title Company |
|---|---|---|---|
| Curran Family Trust | -- | None Listed On Document | |
| Curran Gavin | $549,000 | Commonwealth Land Title | |
| Duncan Ross M | $202,000 | Southland Title Corporation |
Source: Public Records
Mortgage History
We collect this data history from publicly available records. To have your information removed, we recommend requesting removal directly through your county’s website.
| Date | Status | Borrower | Loan Amount |
|---|---|---|---|
| Previous Owner | Curran Gavin | $494,100 | |
| Previous Owner | Duncan Ross M | $157,600 | |
| Closed | Curran Gavin | $54,900 |
Source: Public Records
Tax History
| Year | Tax Paid | Tax Assessment Tax Assessment Total Assessment is a certain percentage of the fair market value that is determined by local assessors to be the total taxable value of land and additions on the property. | Land | Improvement |
|---|---|---|---|---|
| 2025 | $7,983 | $765,252 | $677,763 | $87,489 |
| 2024 | $7,983 | $750,248 | $664,474 | $85,774 |
| 2023 | $7,777 | $735,538 | $651,445 | $84,093 |
| 2022 | $7,629 | $721,116 | $638,671 | $82,445 |
| 2021 | $7,455 | $706,977 | $626,148 | $80,829 |
| 2020 | $7,414 | $699,728 | $619,727 | $80,001 |
| 2019 | $7,250 | $686,008 | $607,575 | $78,433 |
| 2018 | $7,123 | $672,557 | $595,661 | $76,896 |
| 2017 | $6,976 | $659,370 | $583,981 | $75,389 |
| 2016 | $6,667 | $646,442 | $572,531 | $73,911 |
| 2015 | $6,568 | $636,732 | $563,931 | $72,801 |
| 2014 | $5,947 | $575,000 | $509,691 | $65,309 |
Source: Public Records
Map
Nearby Homes
- 4652 Charnock Dr
- 4512 Robinwood Cir
- 4881 Winvale Ave
- 4862 Gainsport Cir
- 9 Badger Pass
- 12 Silverwood Unit 19
- 5022 Dutcher Ave
- 4141 Pleasant St
- 25 Cheyenne Unit 68
- 4122 Loma St
- 26 Helena Unit 69
- 2 Sunflower Unit 29
- 5 Deer Creek
- 18 Heritage
- 13 Sunflower
- 15071 Talley St
- 45 Golden Glen St Unit 75
- 14781 Deer Park St
- 45 Oval Rd
- 3981 Cedron St
- 4612 Ranchgrove Dr
- 4592 Ranchgrove Dr
- 4582 Ranchgrove Dr
- 4622 Ranchgrove Dr
- 4601 Abbotswood Cir
- 4611 Abbotswood Cir
- 4591 Abbotswood Cir
- 4621 Abbotswood Cir
- 4632 Ranchgrove Dr
- 4601 Ranchgrove Dr
- 4631 Abbotswood Cir
- 4611 Ranchgrove Dr
- 4591 Ranchgrove Dr
- 4621 Ranchgrove Dr
- 4581 Ranchgrove Dr
- 4642 Ranchgrove Dr
- 4641 Abbotswood Cir
- 4631 Ranchgrove Dr
- 4571 Ranchgrove Dr
- 4652 Ranchgrove Dr
Your Personal Tour Guide
Ask me questions while you tour the home.