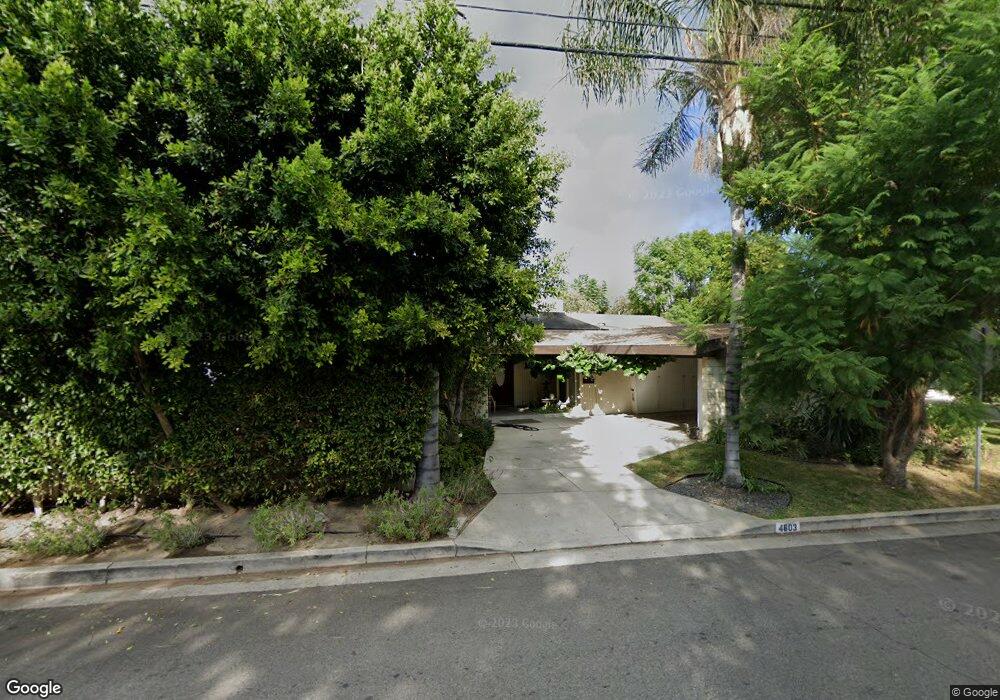
4603 Burnet Ave Sherman Oaks, CA 91403
Estimated Value: $1,711,000 - $1,999,000
3
Beds
3
Baths
2,392
Sq Ft
$772/Sq Ft
Est. Value
About This Home
This home is located at 4603 Burnet Ave, Sherman Oaks, CA 91403 and is currently estimated at $1,845,859, approximately $771 per square foot. 4603 Burnet Ave is a home located in Los Angeles County with nearby schools including Van Nuys High School, Sherman Oaks Elementary Charter School, and Ivy Bound Academy of Math Sci and Tech Charter Middle.
Ownership History
Date
Name
Owned For
Owner Type
Purchase Details
Closed on
Nov 4, 1998
Sold by
Pari Nourmand & Valley Health Pharmacy
Bought by
Esmailzadeh Houshang and Nourmand Pari
Current Estimated Value
Home Financials for this Owner
Home Financials are based on the most recent Mortgage that was taken out on this home.
Original Mortgage
$227,000
Outstanding Balance
$49,331
Interest Rate
6.54%
Estimated Equity
$1,796,528
Purchase Details
Closed on
Jun 19, 1997
Sold by
Esmailzadeh Houshang
Bought by
Valley Health Pharmacy Inc
Purchase Details
Closed on
Jun 5, 1996
Sold by
Rolfe Kay and Rolfe William C
Bought by
Esmailzadeh Houshang and Nourmand Pari
Home Financials for this Owner
Home Financials are based on the most recent Mortgage that was taken out on this home.
Original Mortgage
$164,000
Interest Rate
4.95%
Create a Home Valuation Report for This Property
The Home Valuation Report is an in-depth analysis detailing your home's value as well as a comparison with similar homes in the area
Home Values in the Area
Average Home Value in this Area
Purchase History
| Date | Buyer | Sale Price | Title Company |
|---|---|---|---|
| Esmailzadeh Houshang | -- | Commonwealth Land Title Co | |
| Valley Health Pharmacy Inc | -- | Provident Title Company | |
| Esmailzadeh Houshang | $205,000 | -- |
Source: Public Records
Mortgage History
| Date | Status | Borrower | Loan Amount |
|---|---|---|---|
| Open | Esmailzadeh Houshang | $227,000 | |
| Previous Owner | Esmailzadeh Houshang | $164,000 |
Source: Public Records
Tax History Compared to Growth
Tax History
| Year | Tax Paid | Tax Assessment Tax Assessment Total Assessment is a certain percentage of the fair market value that is determined by local assessors to be the total taxable value of land and additions on the property. | Land | Improvement |
|---|---|---|---|---|
| 2025 | $5,497 | $442,985 | $265,467 | $177,518 |
| 2024 | $5,497 | $434,300 | $260,262 | $174,038 |
| 2023 | $5,392 | $425,785 | $255,159 | $170,626 |
| 2022 | $5,144 | $417,437 | $250,156 | $167,281 |
| 2021 | $5,069 | $409,252 | $245,251 | $164,001 |
| 2019 | $4,917 | $397,116 | $237,978 | $159,138 |
| 2018 | $4,836 | $389,330 | $233,312 | $156,018 |
| 2016 | $4,600 | $374,213 | $224,253 | $149,960 |
| 2015 | $4,533 | $368,593 | $220,885 | $147,708 |
| 2014 | $4,553 | $361,374 | $216,559 | $144,815 |
Source: Public Records
Map
Nearby Homes
- 4725 Halbrent Ave
- 15218 Dickens St Unit 7
- 15248 Dickens St Unit 103
- 4664 Lemona Ave
- 15123 Camarillo St
- 15231 Greenleaf St
- 15233 Camarillo St
- 14923 Moorpark St Unit 103
- 15027 Ventura Blvd
- 14947 Dickens St Unit 3
- 4551 Kester Ave Unit 1
- 4705 Kester Ave Unit 209
- 15245 La Maida St Unit 301
- 4415 Saugus Ave Unit 209
- 14919 Dickens St Unit 104
- 14919 Dickens St Unit 105
- 14912 Dickens St Unit 1
- 4724 Kester Ave Unit 404
- 4401 Sepulveda Blvd Unit 107
- 15125 Valley Vista Blvd
- 4623 Burnet Ave
- 4616 Columbus Ave
- 4622 Columbus Ave
- 15146 Moorpark St
- 4616 Burnet Ave
- 4629 Burnet Ave
- 4600 Burnet Ave
- 4622 Burnet Ave
- 4628 Columbus Ave
- 4635 Burnet Ave
- 4628 Burnet Ave
- 4634 Columbus Ave
- 4634 Burnet Ave
- 4611 Noble Ave
- 4615 Noble Ave
- 4641 Burnet Ave
- 4621 Noble Ave
- 4605 Noble Ave
- 15153 Ventura Blvd
- 4619 Columbus Ave