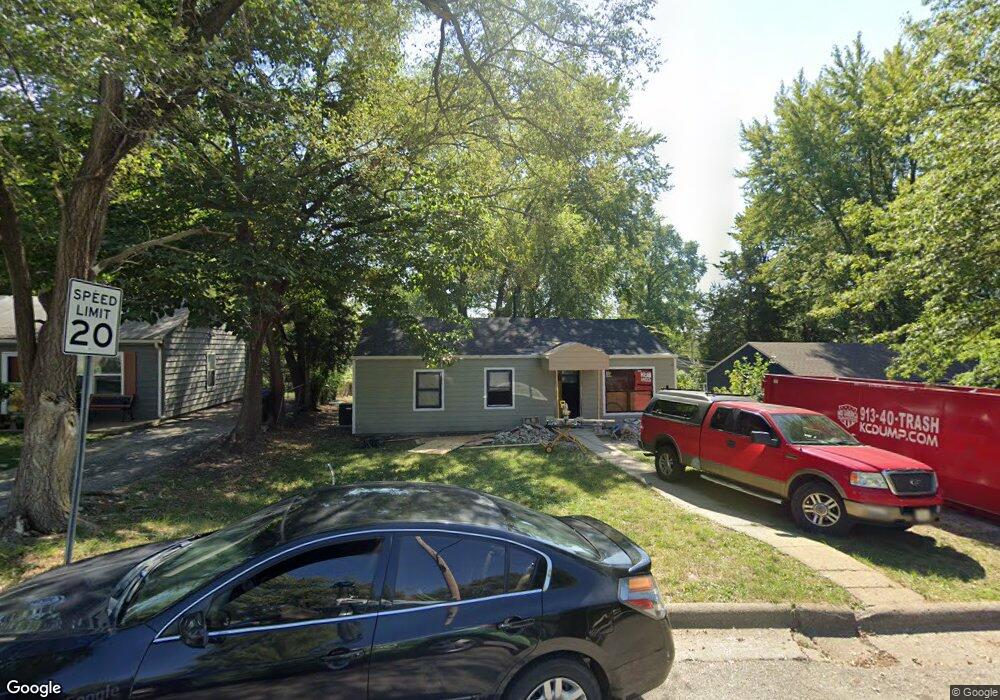
4603 Freeman Ave Kansas City, KS 66102
Coronado NeighborhoodEstimated Value: $140,000 - $166,074
3
Beds
1
Bath
912
Sq Ft
$170/Sq Ft
Est. Value
About This Home
This home is located at 4603 Freeman Ave, Kansas City, KS 66102 and is currently estimated at $155,269, approximately $170 per square foot. 4603 Freeman Ave is a home located in Wyandotte County with nearby schools including Eugene Ware Elementary School, F. L. Schlagle High School, and V Lindsay Sda School.
Ownership History
Date
Name
Owned For
Owner Type
Purchase Details
Closed on
Dec 6, 2023
Sold by
Los Andes Properties Llc
Bought by
Kothari Puja and Kothari Dhiren
Current Estimated Value
Home Financials for this Owner
Home Financials are based on the most recent Mortgage that was taken out on this home.
Original Mortgage
$136,500
Outstanding Balance
$134,357
Interest Rate
7.79%
Mortgage Type
New Conventional
Estimated Equity
$20,912
Purchase Details
Closed on
Jun 28, 2023
Sold by
Fountain City Renewal Llc
Bought by
Los Andes Properties Llc
Purchase Details
Closed on
Mar 17, 2017
Sold by
Smith Gary L and Smith Carrol J
Bought by
Ochoa Fabiola Rodriguez
Home Financials for this Owner
Home Financials are based on the most recent Mortgage that was taken out on this home.
Original Mortgage
$36,000
Interest Rate
4.19%
Mortgage Type
Commercial
Create a Home Valuation Report for This Property
The Home Valuation Report is an in-depth analysis detailing your home's value as well as a comparison with similar homes in the area
Home Values in the Area
Average Home Value in this Area
Purchase History
| Date | Buyer | Sale Price | Title Company |
|---|---|---|---|
| Kothari Puja | -- | Clear Title | |
| Los Andes Properties Llc | -- | Clear Title | |
| Fountain City Renewal Llc | -- | Clear Title | |
| Ochoa Fabiola Rodriguez | -- | None Available |
Source: Public Records
Mortgage History
| Date | Status | Borrower | Loan Amount |
|---|---|---|---|
| Open | Kothari Puja | $136,500 | |
| Previous Owner | Ochoa Fabiola Rodriguez | $36,000 |
Source: Public Records
Tax History Compared to Growth
Tax History
| Year | Tax Paid | Tax Assessment Tax Assessment Total Assessment is a certain percentage of the fair market value that is determined by local assessors to be the total taxable value of land and additions on the property. | Land | Improvement |
|---|---|---|---|---|
| 2024 | $2,760 | $18,883 | $2,569 | $16,314 |
| 2023 | $1,427 | $9,269 | $2,171 | $7,098 |
| 2022 | $1,223 | $7,038 | $1,490 | $5,548 |
| 2021 | $841 | $5,295 | $1,254 | $4,041 |
| 2020 | $760 | $4,813 | $995 | $3,818 |
| 2019 | $680 | $4,335 | $905 | $3,430 |
| 2018 | $673 | $4,312 | $508 | $3,804 |
| 2017 | $637 | $4,062 | $508 | $3,554 |
| 2016 | $651 | $4,102 | $508 | $3,594 |
| 2015 | $659 | $4,102 | $508 | $3,594 |
| 2014 | $725 | $3,970 | $622 | $3,348 |
Source: Public Records
Map
Nearby Homes
- 4517 Maggie Ln
- 4603 Wood Ave
- 1411 N 48th St
- 4850 Wood Ave
- 4333 Victory Dr
- 4920 Washington Ave
- 1522 Valley Rd
- 1138 N 49th St
- 4925 Nebraska Ave
- 4535 Lafayette Ave
- 3910 Walker Ave
- 1522 N 38th St
- 3723 Freeman Ave
- 4205 Waverly Ave
- 1301 N 37th St
- 3618 Wood Ave
- 4806 Cleveland Ave
- 1612 Minnesota Ave
- 4201 Haskell Ave
- 2608 N 46th Terrace
- 4607 Freeman Ave
- 4533 Freeman Ave
- 4611 Freeman Ave
- 1523 N 47th St
- 1601 N 46th St
- 4529 Freeman Ave
- 4615 Freeman Ave
- 1600 N 46th St
- 1607 N 46th St
- 1600 N 45th Terrace
- 1608 N 46th St
- 4525 Freeman Ave
- 4619 Freeman Ave
- 1611 N 46th St
- 1522 N 45th Terrace
- 1601 N 47th St
- 1606 N 45th Terrace
- 1612 N 46th St
- 1518 N 45th Terrace
- 4521 Freeman Ave