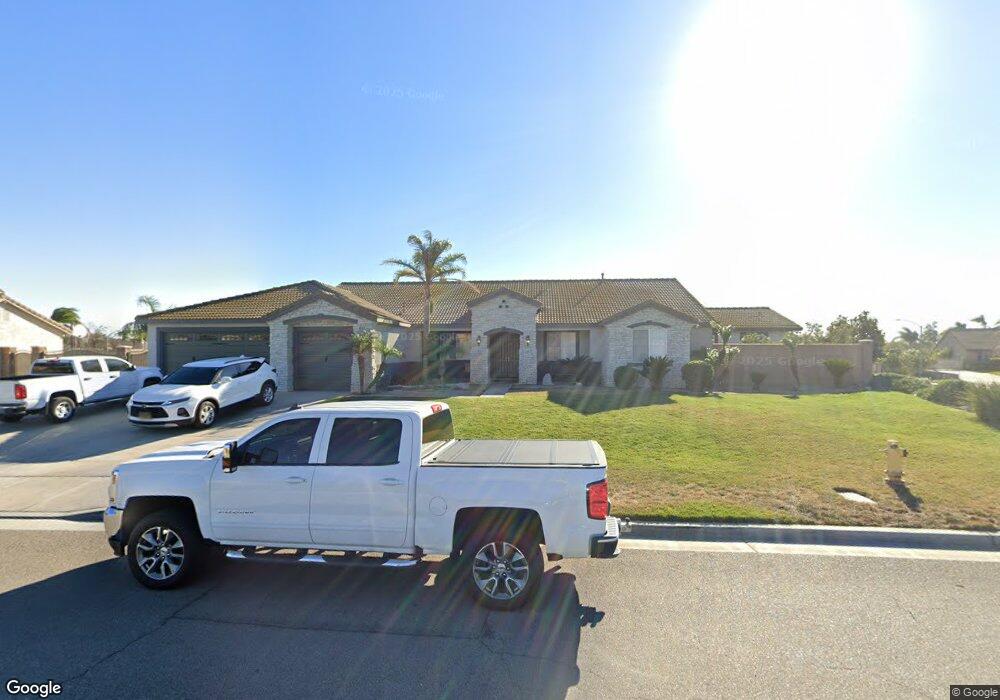
4603 Rockingham Loop Riverside, CA 92509
Estimated Value: $970,114 - $1,126,000
5
Beds
3
Baths
3,164
Sq Ft
$333/Sq Ft
Est. Value
About This Home
This home is located at 4603 Rockingham Loop, Riverside, CA 92509 and is currently estimated at $1,053,029, approximately $332 per square foot. 4603 Rockingham Loop is a home located in Riverside County with nearby schools including Van Buren Elementary School, Mira Loma Middle School, and Jurupa Valley High School.
Ownership History
Date
Name
Owned For
Owner Type
Purchase Details
Closed on
Oct 22, 2010
Sold by
Salido Irma and Bentacu Herman
Bought by
Bentacu Angel
Current Estimated Value
Purchase Details
Closed on
Apr 23, 2003
Sold by
Tract 28808 Llc
Bought by
Salido Irma and Bentacu Herman
Home Financials for this Owner
Home Financials are based on the most recent Mortgage that was taken out on this home.
Original Mortgage
$205,000
Outstanding Balance
$87,808
Interest Rate
5.71%
Mortgage Type
Purchase Money Mortgage
Estimated Equity
$965,221
Create a Home Valuation Report for This Property
The Home Valuation Report is an in-depth analysis detailing your home's value as well as a comparison with similar homes in the area
Home Values in the Area
Average Home Value in this Area
Purchase History
| Date | Buyer | Sale Price | Title Company |
|---|---|---|---|
| Bentacu Angel | -- | None Available | |
| Salido Irma | $319,000 | Orange Coast Title Company |
Source: Public Records
Mortgage History
| Date | Status | Borrower | Loan Amount |
|---|---|---|---|
| Open | Salido Irma | $205,000 |
Source: Public Records
Tax History
| Year | Tax Paid | Tax Assessment Tax Assessment Total Assessment is a certain percentage of the fair market value that is determined by local assessors to be the total taxable value of land and additions on the property. | Land | Improvement |
|---|---|---|---|---|
| 2025 | $7,226 | $499,639 | $192,168 | $307,471 |
| 2023 | $7,226 | $480,239 | $184,706 | $295,533 |
| 2022 | $7,023 | $470,824 | $181,085 | $289,739 |
| 2021 | $6,937 | $461,593 | $177,535 | $284,058 |
| 2020 | $6,855 | $456,861 | $175,715 | $281,146 |
| 2019 | $6,731 | $447,904 | $172,270 | $275,634 |
| 2018 | $6,551 | $439,123 | $168,893 | $270,230 |
| 2017 | $6,460 | $430,514 | $165,582 | $264,932 |
| 2016 | $6,366 | $422,074 | $162,336 | $259,738 |
| 2015 | $6,277 | $415,737 | $159,899 | $255,838 |
| 2014 | $5,918 | $407,596 | $156,768 | $250,828 |
Source: Public Records
Map
Nearby Homes
- 4715 Bain St
- 9931 Union St
- 9861 Mission Blvd Unit 14
- 4856 Poinsetta Place
- 10544 48th St
- 9920 Jurupa Rd
- 4052 Lindsay St
- 10025 Mission Blvd
- 4311 Glenroy Ct
- 9600 51st St
- 9291 Pleasant Hurst Ct
- 9468 Hastings Blvd
- 5484 Street Cedar
- 10538 54th St
- 9342 Hastings Blvd
- 10230 56th St
- 5445 Cedar St
- 0 Fox Tail Ln
- 0 Felspar St Unit DW25190204
- 10621 Jurupa Rd
- 4621 Rockingham Loop
- 4664 Castlerock Rd
- 4640 Cambridge Ct
- 4612 Rockingham Loop
- 4639 Rockingham Loop
- 10095 Kings Ct
- 4682 Castlerock Rd
- 4630 Rockingham Loop
- 4622 Cambridge Ct
- 4633 Cambridge Ct
- 10077 Kings Ct
- 4657 Rockingham Loop
- 10149 Kings Ct
- 10041 Prince Ct
- 4718 Castlerock Rd
- 4615 Cambridge Ct
- 4604 Cambridge Ct
- 4675 Rockingham Loop
- 4709 Castlerock Rd
- 10068 Kings Ct
Your Personal Tour Guide
Ask me questions while you tour the home.