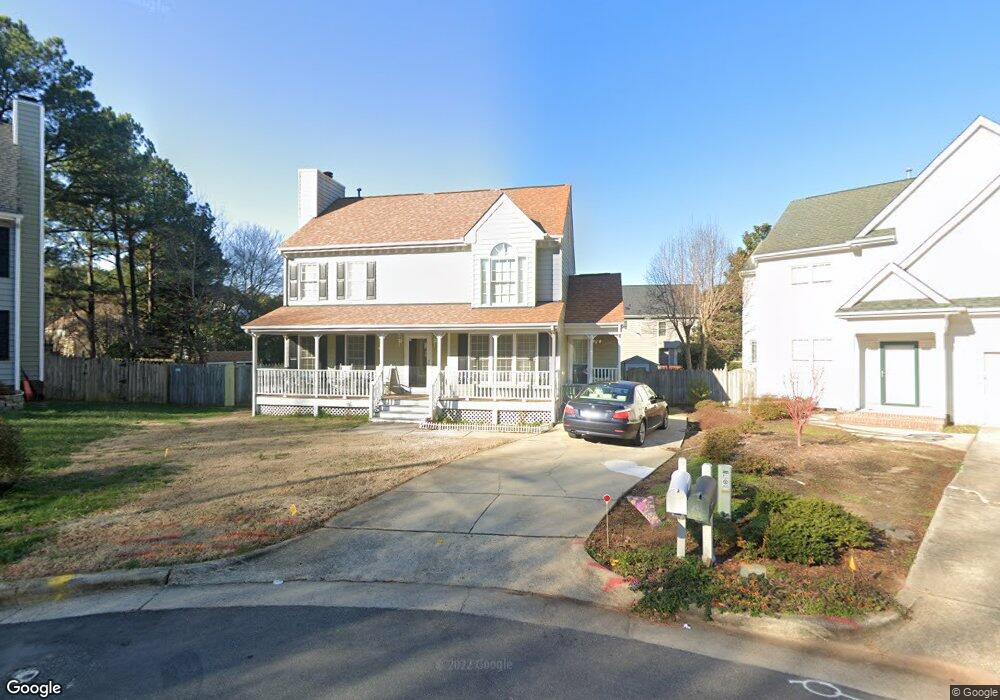
4604 Atterbury Ct Raleigh, NC 27604
Northeast Raleigh NeighborhoodEstimated Value: $381,000 - $393,000
3
Beds
3
Baths
1,993
Sq Ft
$195/Sq Ft
Est. Value
About This Home
This home is located at 4604 Atterbury Ct, Raleigh, NC 27604 and is currently estimated at $387,955, approximately $194 per square foot. 4604 Atterbury Ct is a home located in Wake County with nearby schools including Wilburn Elementary, Durant Road Middle, and Millbrook High School.
Ownership History
Date
Name
Owned For
Owner Type
Purchase Details
Closed on
Aug 24, 2005
Sold by
Meyer Andrew R and Meyer Kathryn E
Bought by
Hill Gina M
Current Estimated Value
Home Financials for this Owner
Home Financials are based on the most recent Mortgage that was taken out on this home.
Original Mortgage
$145,847
Outstanding Balance
$77,156
Interest Rate
5.77%
Mortgage Type
FHA
Estimated Equity
$310,799
Purchase Details
Closed on
May 17, 2002
Sold by
Conseco Finance Servicing Corp
Bought by
Meyer Andrew R and Meyer Kathryn E
Home Financials for this Owner
Home Financials are based on the most recent Mortgage that was taken out on this home.
Original Mortgage
$133,941
Interest Rate
7.12%
Mortgage Type
FHA
Purchase Details
Closed on
May 4, 2001
Sold by
Bright Turissa E
Bought by
Conseco Finance Servicing Corp
Purchase Details
Closed on
Jul 23, 1997
Sold by
Quesada Robert W
Bought by
Bright Turissa E
Home Financials for this Owner
Home Financials are based on the most recent Mortgage that was taken out on this home.
Original Mortgage
$129,858
Interest Rate
7.26%
Create a Home Valuation Report for This Property
The Home Valuation Report is an in-depth analysis detailing your home's value as well as a comparison with similar homes in the area
Home Values in the Area
Average Home Value in this Area
Purchase History
| Date | Buyer | Sale Price | Title Company |
|---|---|---|---|
| Hill Gina M | $147,000 | None Available | |
| Meyer Andrew R | $135,000 | -- | |
| Conseco Finance Servicing Corp | $153,500 | -- | |
| Bright Turissa E | $133,000 | -- |
Source: Public Records
Mortgage History
| Date | Status | Borrower | Loan Amount |
|---|---|---|---|
| Open | Hill Gina M | $145,847 | |
| Previous Owner | Meyer Andrew R | $133,941 | |
| Previous Owner | Bright Turissa E | $129,858 |
Source: Public Records
Tax History Compared to Growth
Tax History
| Year | Tax Paid | Tax Assessment Tax Assessment Total Assessment is a certain percentage of the fair market value that is determined by local assessors to be the total taxable value of land and additions on the property. | Land | Improvement |
|---|---|---|---|---|
| 2025 | $3,334 | $379,997 | $85,000 | $294,997 |
| 2024 | $3,320 | $379,997 | $85,000 | $294,997 |
| 2023 | $2,582 | $235,015 | $45,000 | $190,015 |
| 2022 | $2,400 | $235,015 | $45,000 | $190,015 |
| 2021 | $2,307 | $235,015 | $45,000 | $190,015 |
| 2020 | $2,265 | $235,015 | $45,000 | $190,015 |
| 2019 | $2,055 | $175,605 | $38,000 | $137,605 |
| 2018 | $1,939 | $175,605 | $38,000 | $137,605 |
| 2017 | $1,847 | $175,605 | $38,000 | $137,605 |
| 2016 | $1,809 | $175,605 | $38,000 | $137,605 |
| 2015 | $1,839 | $175,654 | $38,000 | $137,654 |
| 2014 | $1,745 | $175,654 | $38,000 | $137,654 |
Source: Public Records
Map
Nearby Homes
- 4412 Birmingham Way
- 2704 Rockbridge Ct
- 4232 Palafox Ct
- 4236 Tensity Dr
- 4221 Tensity Dr
- 4213 Tensity Dr
- 4608 Dresden Village Dr
- 4905 Knightsbridge Way
- 4608 Mowbray Dr
- 2037 Summer Shire Way
- 2761 Andover Glen Rd
- 2848 Roundleaf Ct
- 4120 Standing Rock Way
- 2817 Roundleaf Ct
- 2800 Dove Ln
- 5121 Amberfield Way
- 4948 Southern Magnolia Dr
- 4401 Liverpool Ln
- 2400 Dorety Place
- 4656 Forest Highland Dr
- 4608 Atterbury Ct
- 4600 Atterbury Ct
- 4509 Birmingham Way
- 4505 Birmingham Way
- 4612 Atterbury Ct
- 5240 Knightsbridge Way
- 4601 Atterbury Ct
- 4513 Birmingham Way
- 4500 Easthampton Dr
- 4504 Easthampton Dr
- 5244 Knightsbridge Way
- 4616 Atterbury Ct
- 4609 Atterbury Ct
- 5236 Knightsbridge Way
- 4508 Easthampton Dr
- 4428 Easthampton Dr
- 4517 Birmingham Way
- 5232 Knightsbridge Way
- 4620 Atterbury Ct
- 4512 Easthampton Dr