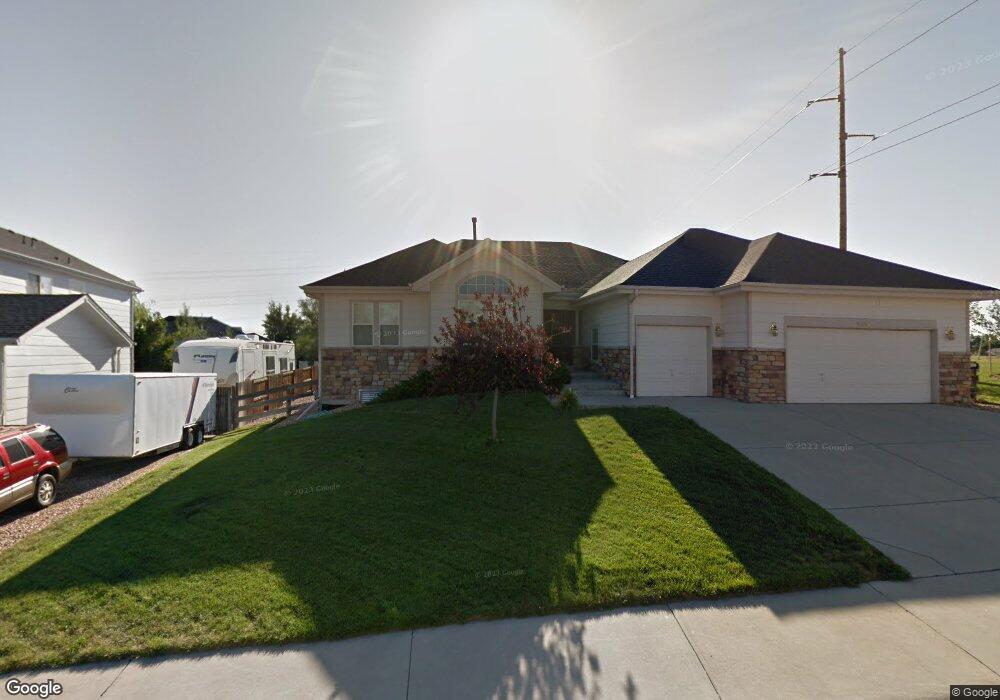
4605 Asbury Dr Castle Rock, CO 80104
Founders Village NeighborhoodEstimated Value: $720,000 - $779,669
4
Beds
4
Baths
4,994
Sq Ft
$150/Sq Ft
Est. Value
About This Home
This home is located at 4605 Asbury Dr, Castle Rock, CO 80104 and is currently estimated at $747,167, approximately $149 per square foot. 4605 Asbury Dr is a home located in Douglas County with nearby schools including Rock Ridge Elementary School, Mesa Middle School, and Douglas County High School.
Ownership History
Date
Name
Owned For
Owner Type
Purchase Details
Closed on
Apr 22, 2016
Sold by
Bruce Bill W and Bruce Maria A
Bought by
Smith William S and Smith Carolyn L
Current Estimated Value
Home Financials for this Owner
Home Financials are based on the most recent Mortgage that was taken out on this home.
Original Mortgage
$417,000
Outstanding Balance
$331,281
Interest Rate
3.68%
Mortgage Type
VA
Estimated Equity
$415,886
Purchase Details
Closed on
Dec 14, 2001
Sold by
Monterrey Heritage Homes Ltd
Bought by
Bruce Bill W and Bruce Maria A
Home Financials for this Owner
Home Financials are based on the most recent Mortgage that was taken out on this home.
Original Mortgage
$266,800
Interest Rate
6%
Mortgage Type
Credit Line Revolving
Purchase Details
Closed on
Dec 6, 2001
Sold by
Olympia Holding Company Llc
Bought by
Monterrey Heritage Homes Ltd
Home Financials for this Owner
Home Financials are based on the most recent Mortgage that was taken out on this home.
Original Mortgage
$266,800
Interest Rate
6%
Mortgage Type
Credit Line Revolving
Create a Home Valuation Report for This Property
The Home Valuation Report is an in-depth analysis detailing your home's value as well as a comparison with similar homes in the area
Home Values in the Area
Average Home Value in this Area
Purchase History
| Date | Buyer | Sale Price | Title Company |
|---|---|---|---|
| Smith William S | $420,000 | First American | |
| Bruce Bill W | $337,556 | -- | |
| Monterrey Heritage Homes Ltd | -- | -- | |
| Monterrey Heritage Homes Ltd | -- | -- |
Source: Public Records
Mortgage History
| Date | Status | Borrower | Loan Amount |
|---|---|---|---|
| Open | Smith William S | $417,000 | |
| Previous Owner | Bruce Bill W | $266,800 |
Source: Public Records
Tax History Compared to Growth
Tax History
| Year | Tax Paid | Tax Assessment Tax Assessment Total Assessment is a certain percentage of the fair market value that is determined by local assessors to be the total taxable value of land and additions on the property. | Land | Improvement |
|---|---|---|---|---|
| 2024 | $8,899 | $57,850 | $11,020 | $46,830 |
| 2023 | $8,951 | $57,850 | $11,020 | $46,830 |
| 2022 | $6,138 | $38,770 | $7,830 | $30,940 |
| 2021 | $6,252 | $38,770 | $7,830 | $30,940 |
| 2020 | $5,979 | $38,160 | $6,000 | $32,160 |
| 2019 | $5,982 | $38,160 | $6,000 | $32,160 |
| 2018 | $5,245 | $33,210 | $5,090 | $28,120 |
| 2017 | $5,049 | $33,210 | $5,090 | $28,120 |
| 2016 | $3,362 | $31,050 | $4,630 | $26,420 |
| 2015 | $3,405 | $31,050 | $4,630 | $26,420 |
| 2014 | $3,249 | $29,100 | $3,420 | $25,680 |
Source: Public Records
Map
Nearby Homes
- 718 Blue Teal Dr
- 4365 Hidden Gulch Rd
- 612 Blue Teal Dr
- 487 Hideaway Ct
- 535 Howe St
- 650 Howe Cir
- 5086 Basalt Ridge Cir
- 4735 Basalt Ridge Cir
- 1255 Basalt Ridge Loop
- 160 Las Lunas St
- 970 White Leaf Cir
- 152 Las Lunas St
- 4059 Happy Hollow Dr
- 1178 McMurdo Cir
- 4423 McMurdo Ct
- 950 Sundown Dr
- 4011 Happy Hollow Dr
- 5326 E Howe St
- 379 Silver Rock Trail
- 364 N Willow St
- 4607 Asbury Dr
- 4621 Bancroft Dr
- 4619 Bancroft Dr
- 4609 Asbury Dr
- 4606 Asbury Dr
- 4617 Bancroft Dr
- 4608 Asbury Dr
- 4602 Asbury Dr
- 4761 Native Birch Ln
- 4604 Asbury Dr
- 4737 Native Birch Ln
- 4615 Bancroft Dr
- 4775 Native Birch Ln
- 4611 Asbury Dr
- 4610 Asbury Dr
- 4612 Bancroft Dr
- 4628 Bancroft Dr
- 4700 Native Birch Ln
- 4613 Bancroft Dr
- 4626 Bancroft Dr