Estimated Value: $182,194 - $199,000
3
Beds
2
Baths
1,298
Sq Ft
$150/Sq Ft
Est. Value
About This Home
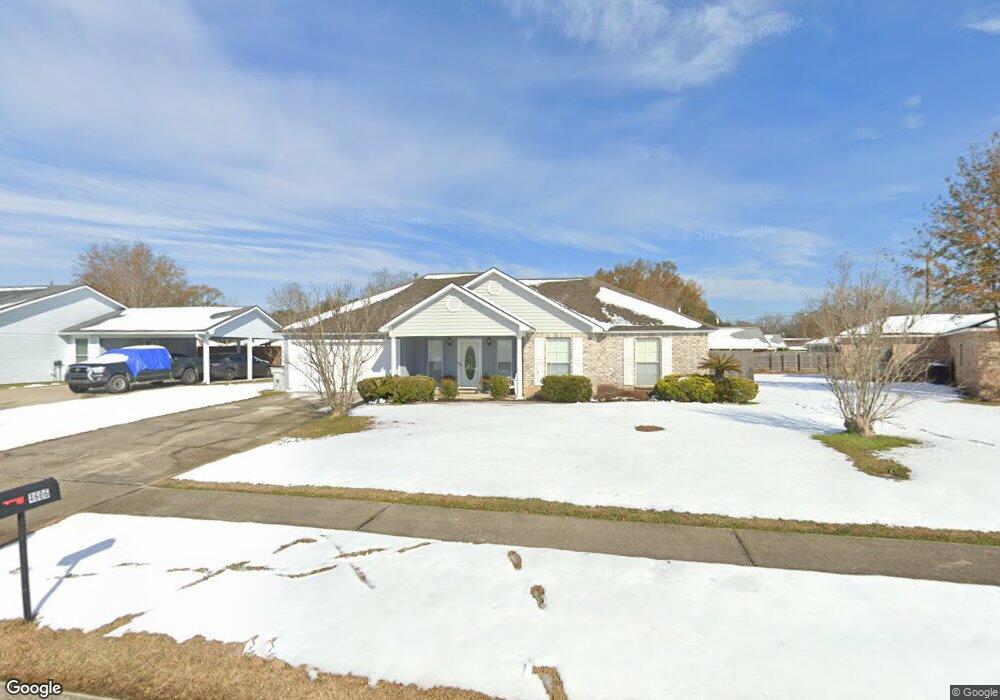
This home is located at 4605 Chapeau Dr, Baker, LA 70714 and is currently estimated at $194,799, approximately $150 per square foot. 4605 Chapeau Dr is a home located in East Baton Rouge Parish with nearby schools including Baker Heights Elementary School, Baker Middle School, and Baker High School.
Ownership History
Date
Name
Owned For
Owner Type
Purchase Details
Closed on
Apr 30, 2004
Sold by
Matthews Myron
Bought by
Dyer Corey and Abernathy,Joy
Current Estimated Value
Home Financials for this Owner
Home Financials are based on the most recent Mortgage that was taken out on this home.
Original Mortgage
$13,000
Outstanding Balance
$6,044
Interest Rate
5.38%
Mortgage Type
New Conventional
Estimated Equity
$188,755
Purchase Details
Closed on
Apr 26, 1999
Sold by
Forrest Jimmy Allen and Forrest Marilyn Crouch
Bought by
Dyer Carolyn Anderson
Home Financials for this Owner
Home Financials are based on the most recent Mortgage that was taken out on this home.
Original Mortgage
$76,687
Interest Rate
7.16%
Mortgage Type
FHA
Purchase Details
Closed on
Feb 1, 1999
Sold by
Quadvest Inc
Bought by
Forrest Jimmy Allen and Forrest Marilyn Crouch
Home Financials for this Owner
Home Financials are based on the most recent Mortgage that was taken out on this home.
Original Mortgage
$68,000
Interest Rate
6.79%
Mortgage Type
Purchase Money Mortgage
Create a Home Valuation Report for This Property
The Home Valuation Report is an in-depth analysis detailing your home's value as well as a comparison with similar homes in the area
Home Values in the Area
Average Home Value in this Area
Purchase History
| Date | Buyer | Sale Price | Title Company |
|---|---|---|---|
| Dyer Corey | $13,000 | -- | |
| Dyer Carolyn Anderson | $85,000 | -- | |
| Forrest Jimmy Allen | $10,000 | -- |
Source: Public Records
Mortgage History
| Date | Status | Borrower | Loan Amount |
|---|---|---|---|
| Open | Dyer Corey | $13,000 | |
| Previous Owner | Dyer Carolyn Anderson | $76,687 | |
| Previous Owner | Forrest Jimmy Allen | $68,000 |
Source: Public Records
Tax History
| Year | Tax Paid | Tax Assessment Tax Assessment Total Assessment is a certain percentage of the fair market value that is determined by local assessors to be the total taxable value of land and additions on the property. | Land | Improvement |
|---|---|---|---|---|
| 2024 | $1,178 | $17,882 | $1,500 | $16,382 |
| 2023 | $1,136 | $14,480 | $1,500 | $12,980 |
| 2022 | $1,626 | $14,480 | $1,500 | $12,980 |
| 2021 | $1,612 | $14,480 | $1,500 | $12,980 |
| 2020 | $1,633 | $14,480 | $1,500 | $12,980 |
| 2019 | $1,498 | $12,850 | $1,500 | $11,350 |
| 2018 | $1,479 | $12,850 | $1,500 | $11,350 |
| 2017 | $1,479 | $12,850 | $1,500 | $11,350 |
| 2016 | $647 | $12,850 | $1,500 | $11,350 |
| 2015 | $428 | $10,900 | $1,500 | $9,400 |
| 2014 | $426 | $10,900 | $1,500 | $9,400 |
| 2013 | -- | $10,900 | $1,500 | $9,400 |
Source: Public Records
Map
Nearby Homes
- 4406 Fourchon Dr
- 1011 Sherron Ave
- 4502 Fausse Dr
- 5125 Weston St
- 5137 Weston St
- Lot E Hazeloak Dr
- Lot C Hazeloak Dr
- 1306 Hazeloak Dr
- 1006 Shilo Ave
- 5601 E Tigre Chenes Ct
- 5245 Groom Rd
- 999 No Street Name Other
- 1271 Doctor Mlk Junior Ln
- 1261 Doctor Mlk Junior Ln
- 943 Whitehead St
- 3639 Groom Rd
- 1855 Mchugh Rd
- 1068 Epperson St
- 4907 Baker Blvd
- 801 Chipley St
- 4603 Chapeau Dr
- 4606 Harding St
- 4608 Harding St
- 4601 Chapeau Dr
- 4606 Chapeau Dr
- 4610 Harding St
- 4610 Harding St
- 4610 Harding St
- 4604 Chapeau Dr
- 4604 Harding St
- 4602 Harding St
- 4507 Chapeau Dr
- 806 Buras Ave
- 4702 Harding St
- 4602 Chapeau Dr
- 4510 Harding St
- 804 Buras Ave
- 4505 Chapeau Dr
- 4605 Breckenridge Dr
- 4508 Chapeau Dr
Your Personal Tour Guide
Ask me questions while you tour the home.