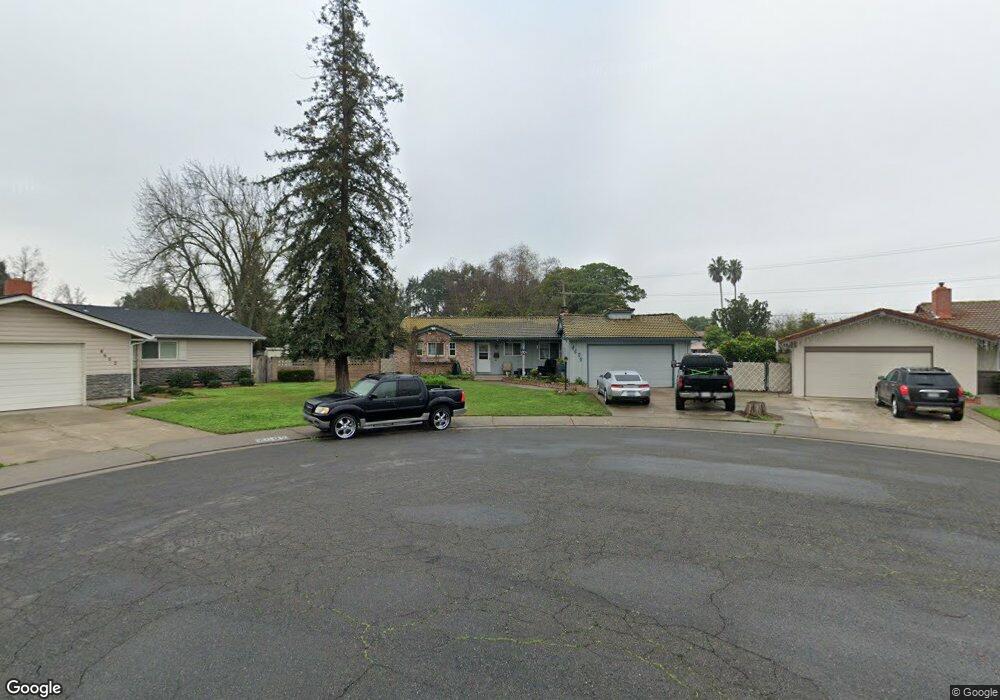
4605 Mark Twain Place Stockton, CA 95207
Lincoln Village NeighborhoodEstimated Value: $408,000 - $454,000
4
Beds
3
Baths
1,762
Sq Ft
$249/Sq Ft
Est. Value
About This Home
This home is located at 4605 Mark Twain Place, Stockton, CA 95207 and is currently estimated at $439,143, approximately $249 per square foot. 4605 Mark Twain Place is a home located in San Joaquin County with nearby schools including Maxine Hong Kingston Elementary School, Adams Elementary School, and Pulliam Elementary School.
Ownership History
Date
Name
Owned For
Owner Type
Purchase Details
Closed on
Nov 15, 2019
Sold by
Aldine Dona D G
Bought by
Aldine Deann K
Current Estimated Value
Home Financials for this Owner
Home Financials are based on the most recent Mortgage that was taken out on this home.
Original Mortgage
$9,131
Outstanding Balance
$8,033
Interest Rate
3.6%
Estimated Equity
$431,110
Purchase Details
Closed on
Mar 26, 2015
Sold by
Vaccarezza Kathryn and Elaine Holt Eggleston Revocabl
Bought by
Vaccarezza Kathryn
Purchase Details
Closed on
Sep 3, 1996
Sold by
Eggleston Elaine Holt and Eggleston Elaine H
Bought by
The Elaine Holt Eggleston Revocable Livi and Eggleston Elaine Holt
Create a Home Valuation Report for This Property
The Home Valuation Report is an in-depth analysis detailing your home's value as well as a comparison with similar homes in the area
Home Values in the Area
Average Home Value in this Area
Purchase History
| Date | Buyer | Sale Price | Title Company |
|---|---|---|---|
| Aldine Deann K | -- | Chicago Title Company | |
| Hall Sylvia D | -- | Chicago Title Company | |
| Hall Sylvia D | $310,000 | Chicago Title Company | |
| Vaccarezza Kathryn | -- | None Available | |
| The Elaine Holt Eggleston Revocable Livi | -- | -- |
Source: Public Records
Mortgage History
| Date | Status | Borrower | Loan Amount |
|---|---|---|---|
| Open | Hall Sylvia D | $9,131 | |
| Closed | Hall Sylvia D | $9,131 | |
| Open | Aldine Deann K | $304,385 |
Source: Public Records
Tax History
| Year | Tax Paid | Tax Assessment Tax Assessment Total Assessment is a certain percentage of the fair market value that is determined by local assessors to be the total taxable value of land and additions on the property. | Land | Improvement |
|---|---|---|---|---|
| 2025 | $4,210 | $339,024 | $65,616 | $273,408 |
| 2024 | $4,144 | $332,378 | $64,330 | $268,048 |
| 2023 | $4,051 | $325,862 | $63,069 | $262,793 |
| 2022 | $3,978 | $319,474 | $61,833 | $257,641 |
| 2021 | $3,822 | $313,211 | $60,621 | $252,590 |
| 2020 | $3,897 | $310,000 | $60,000 | $250,000 |
| 2019 | $1,013 | $77,241 | $16,590 | $60,651 |
| 2018 | $994 | $75,727 | $16,265 | $59,462 |
| 2017 | $943 | $74,244 | $15,947 | $58,297 |
| 2016 | $959 | $72,789 | $15,635 | $57,154 |
| 2015 | $868 | $71,696 | $15,400 | $56,296 |
| 2014 | $826 | $70,291 | $15,098 | $55,193 |
Source: Public Records
Map
Nearby Homes
- 328 Northbank Ct Unit 79
- 4332 Pacific Ave Unit 80
- 4332 Pacific Ave Unit 25
- 4332 Pacific Ave Unit 42
- 4332 Pacific Ave
- 701 W Bianchi Rd
- 4229 N Commerce St
- 40 E Harper St
- 6 W Fargo St
- 95 W Downs St
- 58 E Fargo St
- 4119 N Commerce St
- 4830 Kentfield Rd
- 4452 Cotton Ct
- 5310 N El Dorado St Unit 7
- 190 W Mckenzie Ave
- 5501 Claremont Ave
- 39 W Fulton St
- 1109 W Churchill St
- 32 E Mckenzie Ave
- 4602 Mark Twain Place
- 4613 Mark Twain Place
- 4524 Nugget Ave
- 4602 Nugget Ave
- 4619 Mark Twain Place
- 4608 Mark Twain Place
- 4608 Nugget Ave
- 4616 Mark Twain Place
- 4625 Mark Twain Place
- 4622 Mark Twain Place
- 4614 Nugget Ave
- 4615 Lemmore Place
- 4521 Nugget Ave
- 4515 Nugget Ave
- 4603 Nugget Ave
- 4623 Lemmore Place
- 4628 Mark Twain Place
- 4509 Nugget Ave
- 4611 Lemmore Place
- 67 Fallon Place
Your Personal Tour Guide
Ask me questions while you tour the home.