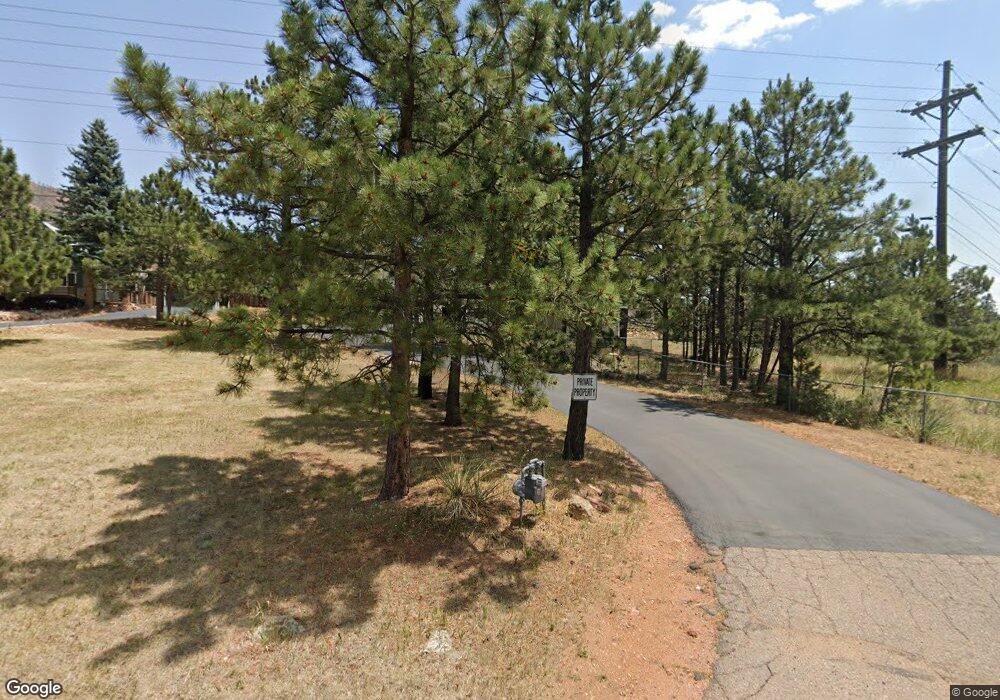
4605 Mesa Rd Cascade, CO 80809
Cascade-Chipita Park NeighborhoodEstimated Value: $437,000 - $637,000
2
Beds
3
Baths
1,548
Sq Ft
$344/Sq Ft
Est. Value
About This Home
This home is located at 4605 Mesa Rd, Cascade, CO 80809 and is currently estimated at $532,637, approximately $344 per square foot. 4605 Mesa Rd is a home located in El Paso County with nearby schools including Ute Pass Elementary School, Manitou Springs Middle School, and Manitou Springs High School.
Ownership History
Date
Name
Owned For
Owner Type
Purchase Details
Closed on
Dec 16, 2015
Sold by
Gafford Colleen
Bought by
C Gafford Living Trust
Current Estimated Value
Purchase Details
Closed on
Sep 19, 2001
Sold by
Dehart William and Dehart Roberta M
Bought by
Gafford Colleen
Home Financials for this Owner
Home Financials are based on the most recent Mortgage that was taken out on this home.
Original Mortgage
$80,000
Outstanding Balance
$30,946
Interest Rate
6.88%
Estimated Equity
$501,691
Purchase Details
Closed on
Sep 2, 1976
Bought by
Gafford C Living Trust
Purchase Details
Closed on
Jan 11, 1974
Bought by
Gafford C Living Trust
Purchase Details
Closed on
Mar 12, 1970
Bought by
Gafford C Living Trust
Purchase Details
Closed on
Sep 23, 1969
Bought by
Gafford C Living Trust
Create a Home Valuation Report for This Property
The Home Valuation Report is an in-depth analysis detailing your home's value as well as a comparison with similar homes in the area
Home Values in the Area
Average Home Value in this Area
Purchase History
| Date | Buyer | Sale Price | Title Company |
|---|---|---|---|
| C Gafford Living Trust | -- | None Available | |
| Gafford Colleen | $158,000 | -- | |
| Gafford C Living Trust | -- | -- | |
| Gafford C Living Trust | -- | -- | |
| Gafford C Living Trust | -- | -- | |
| Gafford C Living Trust | -- | -- |
Source: Public Records
Mortgage History
| Date | Status | Borrower | Loan Amount |
|---|---|---|---|
| Open | Gafford Colleen | $80,000 |
Source: Public Records
Tax History
| Year | Tax Paid | Tax Assessment Tax Assessment Total Assessment is a certain percentage of the fair market value that is determined by local assessors to be the total taxable value of land and additions on the property. | Land | Improvement |
|---|---|---|---|---|
| 2025 | $2,207 | $37,460 | -- | -- |
| 2024 | $1,574 | $34,690 | $6,910 | $27,780 |
| 2023 | $1,574 | $34,690 | $6,910 | $27,780 |
| 2022 | $1,623 | $22,890 | $5,730 | $17,160 |
| 2021 | $1,694 | $23,550 | $5,900 | $17,650 |
| 2020 | $1,533 | $20,300 | $4,950 | $15,350 |
| 2019 | $1,619 | $20,300 | $4,950 | $15,350 |
| 2018 | $1,461 | $17,230 | $4,540 | $12,690 |
| 2017 | $1,286 | $17,230 | $4,540 | $12,690 |
| 2016 | $1,244 | $16,790 | $5,010 | $11,780 |
| 2015 | $1,234 | $16,790 | $5,010 | $11,780 |
| 2014 | $1,121 | $16,310 | $4,780 | $11,530 |
Source: Public Records
Map
Nearby Homes
- 7930 Topeka Ave
- 7915 Topeka Ave
- 4580 Hagerman Ave
- 4519 Edwards Place
- 7760 Marriott Rd
- 4540 Fountain Ave
- 4840 Pikes Peak Hwy
- 8240 Emporia
- 0 Colorado 24
- 4410 Martindale Ave
- 8225 W US Highway 24
- 5330 Chipita Pines Dr
- 7415 W US Highway 24
- 5295 Kulsa Rd
- 5265 Kulsa Rd
- 5260 Kulsa Rd
- 8850 Chipita Park Rd
- 9110 Mountain Rd
- 9025 Picabo Rd
- 5975 Wellington Rd
Your Personal Tour Guide
Ask me questions while you tour the home.