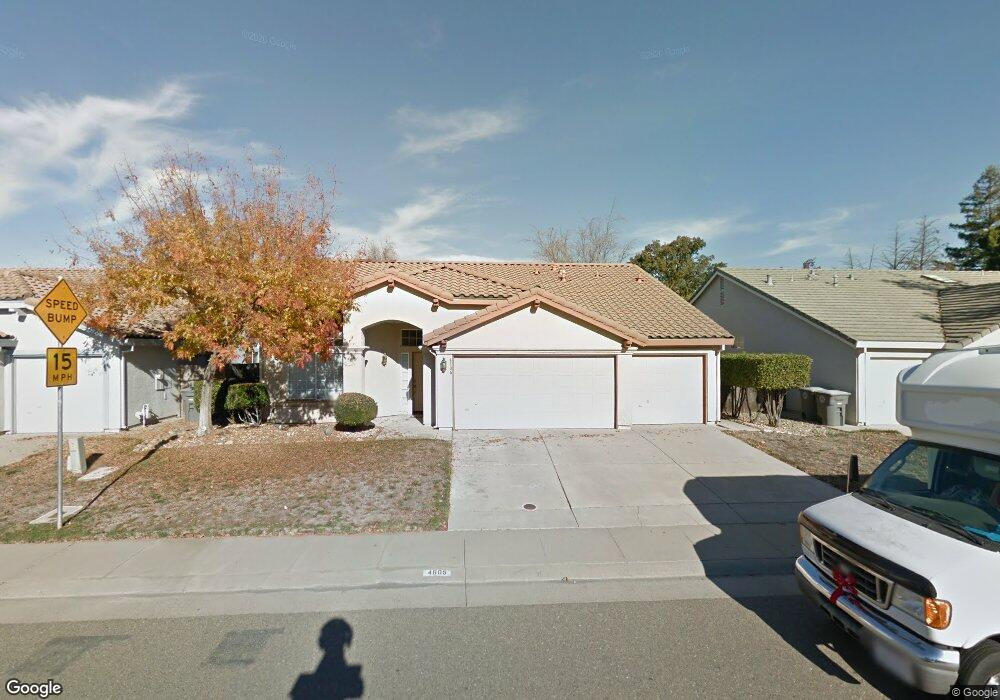
4605 Shenango Way Elk Grove, CA 95758
North West Elk Grove NeighborhoodEstimated Value: $526,646 - $562,000
3
Beds
2
Baths
1,608
Sq Ft
$339/Sq Ft
Est. Value
About This Home
This home is located at 4605 Shenango Way, Elk Grove, CA 95758 and is currently estimated at $544,912, approximately $338 per square foot. 4605 Shenango Way is a home located in Sacramento County with nearby schools including Joseph Sims Elementary School, Harriet G. Eddy Middle School, and Laguna Creek High School.
Ownership History
Date
Name
Owned For
Owner Type
Purchase Details
Closed on
Dec 4, 2020
Sold by
Kelley Daphne D
Bought by
Kelley Daphne D and The Daphne D Kelley Living Tru
Current Estimated Value
Purchase Details
Closed on
Feb 28, 1996
Sold by
Freeman Carl A and Gazelle Freeman R
Bought by
Kelley Daphne D
Home Financials for this Owner
Home Financials are based on the most recent Mortgage that was taken out on this home.
Original Mortgage
$127,200
Outstanding Balance
$5,000
Interest Rate
7.05%
Estimated Equity
$539,912
Purchase Details
Closed on
Jan 28, 1994
Sold by
Winncrest Homes Ii
Bought by
Freeman Carl A and Gazelle Freeman R
Home Financials for this Owner
Home Financials are based on the most recent Mortgage that was taken out on this home.
Original Mortgage
$142,450
Interest Rate
4.5%
Create a Home Valuation Report for This Property
The Home Valuation Report is an in-depth analysis detailing your home's value as well as a comparison with similar homes in the area
Home Values in the Area
Average Home Value in this Area
Purchase History
| Date | Buyer | Sale Price | Title Company |
|---|---|---|---|
| Kelley Daphne D | -- | None Available | |
| Kelley Daphne D | $134,000 | Placer Title Company | |
| Freeman Carl A | $150,000 | First American Title Ins Co |
Source: Public Records
Mortgage History
| Date | Status | Borrower | Loan Amount |
|---|---|---|---|
| Open | Kelley Daphne D | $127,200 | |
| Previous Owner | Freeman Carl A | $142,450 |
Source: Public Records
Tax History Compared to Growth
Tax History
| Year | Tax Paid | Tax Assessment Tax Assessment Total Assessment is a certain percentage of the fair market value that is determined by local assessors to be the total taxable value of land and additions on the property. | Land | Improvement |
|---|---|---|---|---|
| 2025 | $2,808 | $222,413 | $69,758 | $152,655 |
| 2024 | $2,808 | $218,053 | $68,391 | $149,662 |
| 2023 | $2,729 | $213,778 | $67,050 | $146,728 |
| 2022 | $2,686 | $209,587 | $65,736 | $143,851 |
| 2021 | $2,628 | $205,479 | $64,448 | $141,031 |
| 2020 | $2,589 | $203,373 | $63,788 | $139,585 |
| 2019 | $2,539 | $199,387 | $62,538 | $136,849 |
| 2018 | $2,473 | $195,478 | $61,312 | $134,166 |
| 2017 | $2,424 | $191,646 | $60,110 | $131,536 |
| 2016 | $2,319 | $187,889 | $58,932 | $128,957 |
| 2015 | $2,274 | $185,067 | $58,047 | $127,020 |
| 2014 | $2,246 | $181,442 | $56,910 | $124,532 |
Source: Public Records
Map
Nearby Homes
- 9313 Edisto Way
- 4521 Freitag Way
- 5201 Laguna Oaks Dr Unit 96
- 5201 Laguna Oaks Dr Unit 12
- 5201 Laguna Oaks Dr Unit 70
- 5201 Laguna Oaks Dr
- 9144 Hensley Way
- 9186 Jamel Ct
- 9139 Hensley Way
- 9121 Hensley Way
- 5129 Tegan Rd
- Residence 2125 Plan at Tegan Estates
- Residence 1845 Plan at Tegan Estates
- Residence 1960 Plan at Tegan Estates
- Residence 1850 Plan at Tegan Estates
- 3909 Packwood Way
- 5208 Misty Meadow Way
- 5400 Lawnview Way
- 5408 E Brook Way
- 5013 Efthemia Way
- 4609 Shenango Way
- 4601 Shenango Way
- 9350 Laguna Pointe Way
- 9346 Laguna Pointe Way
- 9370 Laguna Pointe Way
- 4521 Shenango Way
- 4613 Shenango Way
- 9354 Laguna Pointe Way
- 9326 Laguna Pointe Way
- 9342 Laguna Pointe Way
- 4606 Shenango Way
- 4610 Shenango Way
- 9366 Laguna Pointe Way
- 4600 Shenango Way
- 9011 Shenango Way
- 9374 Laguna Pointe Way
- 9330 Laguna Pointe Way
- 4522 Shenango Way
- 9358 Laguna Pointe Way
- 9338 Laguna Pointe Way