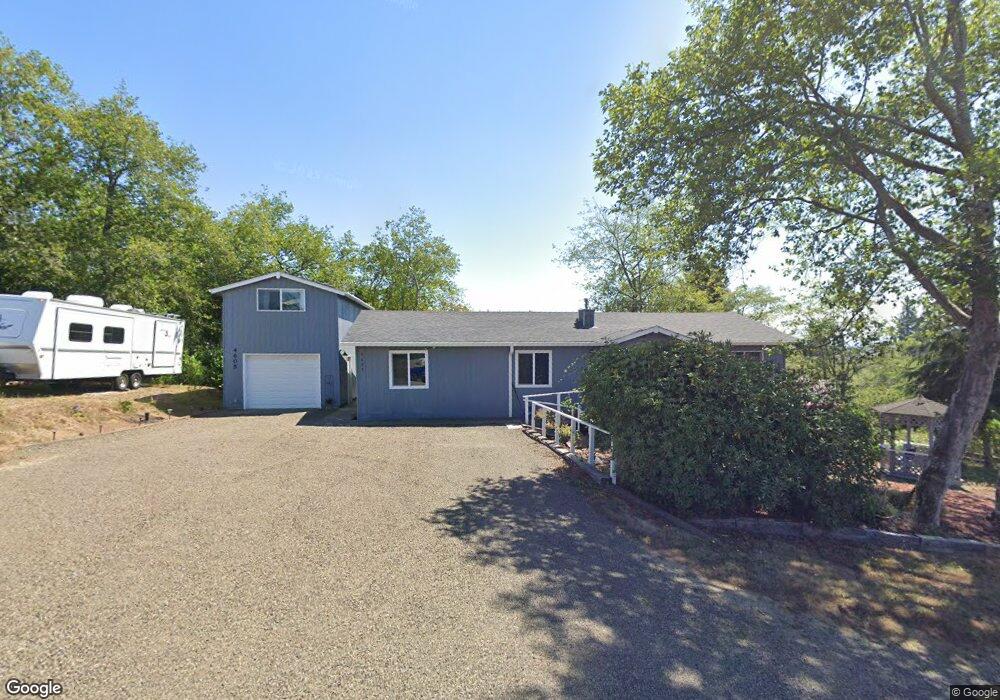
4605 Sunset Dr Tillamook, OR 97141
Estimated Value: $443,269 - $737,000
3
Beds
4
Baths
2,104
Sq Ft
$263/Sq Ft
Est. Value
About This Home
This home is located at 4605 Sunset Dr, Tillamook, OR 97141 and is currently estimated at $553,317, approximately $262 per square foot. 4605 Sunset Dr is a home located in Tillamook County with nearby schools including Tillamook High School.
Ownership History
Date
Name
Owned For
Owner Type
Purchase Details
Closed on
Aug 19, 2011
Sold by
Ton Anthony N and Dunn Ton Kristen H
Bought by
Dunn Kristen H
Current Estimated Value
Purchase Details
Closed on
Oct 11, 2006
Sold by
Tanler Clay and Tanler Rose M
Bought by
Ton Anthony N and Ton Kristen H
Home Financials for this Owner
Home Financials are based on the most recent Mortgage that was taken out on this home.
Original Mortgage
$247,500
Interest Rate
7.35%
Mortgage Type
Purchase Money Mortgage
Purchase Details
Closed on
Apr 20, 2006
Sold by
Miller John Mason
Bought by
Tanler Clay and Tanler Rose M
Purchase Details
Closed on
Mar 24, 2005
Sold by
Miller Sherman F and Miller Helen M
Bought by
Miller Miller John M John M and Miller De Lopez Martha A
Create a Home Valuation Report for This Property
The Home Valuation Report is an in-depth analysis detailing your home's value as well as a comparison with similar homes in the area
Home Values in the Area
Average Home Value in this Area
Purchase History
| Date | Buyer | Sale Price | Title Company |
|---|---|---|---|
| Dunn Kristen H | -- | None Available | |
| Ton Anthony N | $301,500 | Fidelity Natl Title Co Of Or | |
| Tanler Clay | $20,000 | None Available | |
| Tanler Clay | $20,000 | None Available | |
| Miller Miller John M John M | -- | -- |
Source: Public Records
Mortgage History
| Date | Status | Borrower | Loan Amount |
|---|---|---|---|
| Previous Owner | Ton Anthony N | $247,500 |
Source: Public Records
Tax History Compared to Growth
Tax History
| Year | Tax Paid | Tax Assessment Tax Assessment Total Assessment is a certain percentage of the fair market value that is determined by local assessors to be the total taxable value of land and additions on the property. | Land | Improvement |
|---|---|---|---|---|
| 2024 | $2,856 | $274,010 | $57,320 | $216,690 |
| 2023 | $2,839 | $266,030 | $55,650 | $210,380 |
| 2022 | $2,742 | $258,290 | $54,030 | $204,260 |
| 2021 | $2,662 | $250,770 | $52,460 | $198,310 |
| 2020 | $2,591 | $243,470 | $50,930 | $192,540 |
| 2019 | $2,462 | $236,380 | $49,450 | $186,930 |
| 2018 | $2,400 | $229,500 | $48,010 | $181,490 |
| 2017 | $2,286 | $222,820 | $46,610 | $176,210 |
| 2016 | $2,120 | $214,530 | $55,780 | $158,750 |
| 2015 | $2,154 | $205,020 | $45,250 | $159,770 |
| 2014 | $2,122 | $199,050 | $43,930 | $155,120 |
| 2013 | -- | $193,260 | $42,650 | $150,610 |
Source: Public Records
Map
Nearby Homes
- 0 Ellen Ave
- 0 Tl2402 Alderbrook Rd
- 0 Tl2400 Alderbrook Rd
- 0 Makinster Rd Unit 1902 24-656
- 0 Makinster Rd Unit 1902 24205450
- 3960 Latimer Rd
- TL#2400 Alderbrook Rd
- 6550 Curl Rd
- 4600 Idaville Rd Unit 36
- 7925 Doughty Rd
- 4000 Idaville Rd
- 3355 Hubert Rd
- 17805 U S 101
- 5240 Sollie Smith Rd N
- 0 Willowbrook Dr Unit 2900 22130754
- 7965 19th St
- 6835 Spruce St
- 6825 Williams Ave
- VL Willowbrook Dr (Tl # 2900)
- 2506 1st St
- 4605 Highway 101 N
- 0 Sunset Dr Unit 1100 16106395
- 0 Sunset Dr
- 4705 Sunset Dr
- V/L Ellen Ave
- 4725 Sunset Dr
- 0 V L 1900 Sunset Dr Unit 23-130
- 4525 Highway 101 N
- 4700 Ellen Ave
- 4755 Highway 101 N
- -1 Ellen Ave
- 4780 Sunset Dr
- 4800 Sunset Dr
- 4720 N Highway 101
- 4805 Highway 101 N
- 4720 Hwy 101 N
- 4239 Highway 101 N
- 4725 Juno Hill Rd
- 4750 Sunset Dr
- 0 Vl Ellen Ave