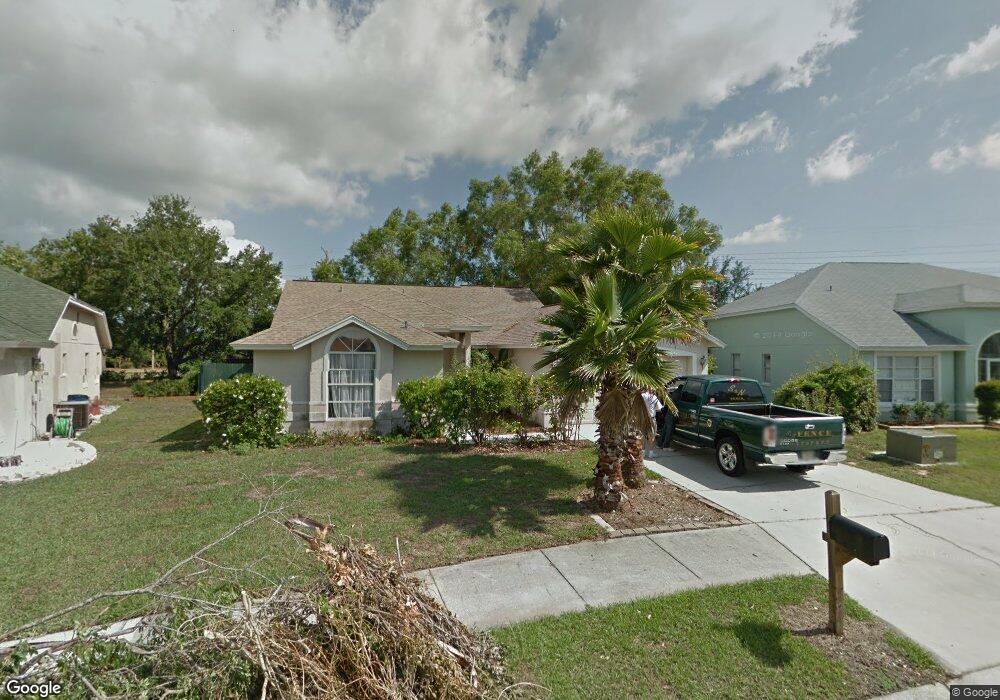
4606 8th Ave E Bradenton, FL 34208
East Bradenton NeighborhoodEstimated Value: $358,116 - $407,000
3
Beds
2
Baths
2,296
Sq Ft
$165/Sq Ft
Est. Value
About This Home
This home is located at 4606 8th Ave E, Bradenton, FL 34208 and is currently estimated at $379,779, approximately $165 per square foot. 4606 8th Ave E is a home located in Manatee County with nearby schools including William H. Bashaw Elementary School, Carlos E. Haile Middle School, and Braden River High School.
Ownership History
Date
Name
Owned For
Owner Type
Purchase Details
Closed on
Jul 1, 2016
Bought by
Progress Residential 2016-1 Bo
Current Estimated Value
Purchase Details
Closed on
Feb 6, 2016
Sold by
Nagy Michael and Nagy Angela
Bought by
Freo Florida Llc
Purchase Details
Closed on
Apr 8, 2011
Sold by
Fukunaka Yoshiro and Fukunaka Anita
Bought by
Nagy Michael and Nagy Angela
Purchase Details
Closed on
Nov 13, 2007
Sold by
Citifinancial Mortgage Co Fl Llc
Bought by
Anita Fukunaka Yoshiro and Anita Fukunata
Home Financials for this Owner
Home Financials are based on the most recent Mortgage that was taken out on this home.
Original Mortgage
$180,500
Interest Rate
6.36%
Mortgage Type
Purchase Money Mortgage
Purchase Details
Closed on
Dec 13, 2002
Sold by
Huffman Margaret S and Smith Margaret
Bought by
Huffman Brent and Huffman Margaret S
Purchase Details
Closed on
Dec 12, 2002
Sold by
Long Robert W
Bought by
Huffman Brent and Huffman Margaret S
Create a Home Valuation Report for This Property
The Home Valuation Report is an in-depth analysis detailing your home's value as well as a comparison with similar homes in the area
Home Values in the Area
Average Home Value in this Area
Purchase History
| Date | Buyer | Sale Price | Title Company |
|---|---|---|---|
| Progress Residential 2016-1 Bo | $100 | -- | |
| Freo Florida Llc | $214,000 | Brightline Title Llc | |
| Nagy Michael | $118,000 | Integrity Title Services Inc | |
| Anita Fukunaka Yoshiro | $190,000 | Buyers Title Inc | |
| Huffman Brent | -- | -- | |
| Huffman Brent | $63,800 | -- |
Source: Public Records
Mortgage History
| Date | Status | Borrower | Loan Amount |
|---|---|---|---|
| Previous Owner | Anita Fukunaka Yoshiro | $180,500 |
Source: Public Records
Tax History
| Year | Tax Paid | Tax Assessment Tax Assessment Total Assessment is a certain percentage of the fair market value that is determined by local assessors to be the total taxable value of land and additions on the property. | Land | Improvement |
|---|---|---|---|---|
| 2025 | $5,882 | $324,893 | $68,000 | $256,893 |
| 2023 | $5,581 | $339,773 | $51,000 | $288,773 |
| 2022 | $5,028 | $293,859 | $45,000 | $248,859 |
| 2021 | $4,339 | $238,144 | $45,000 | $193,144 |
| 2020 | $4,056 | $205,159 | $40,000 | $165,159 |
| 2019 | $4,093 | $205,228 | $40,000 | $165,228 |
| 2018 | $3,910 | $194,000 | $35,000 | $159,000 |
| 2017 | $3,484 | $179,404 | $0 | $0 |
| 2016 | $3,110 | $171,801 | $0 | $0 |
Source: Public Records
Map
Nearby Homes
- 4841 9th Ave E
- 4451 6th Ave E
- 1204 50th St E
- 501 45th St E
- 4203 14th Ave E
- 4416 Spicewood Dr Unit J
- 4416 Spicewood Dr Unit K
- 4412 Spicewood Dr Unit E
- 1428 Blue Horizon Cir
- 3995 Lakewood Ave
- 4212 Neil Ln
- 1002 Pussywillow Ln
- 4612 4th Ave E
- 4005 Palm Ct
- 1510 White Breeze Cove
- 5206 18th Ave E
- 4603 4th Ave E
- 5526 River Sound Terrace
- 302 Americas Cup Blvd
- 3906 Chinaberry Rd
Your Personal Tour Guide
Ask me questions while you tour the home.