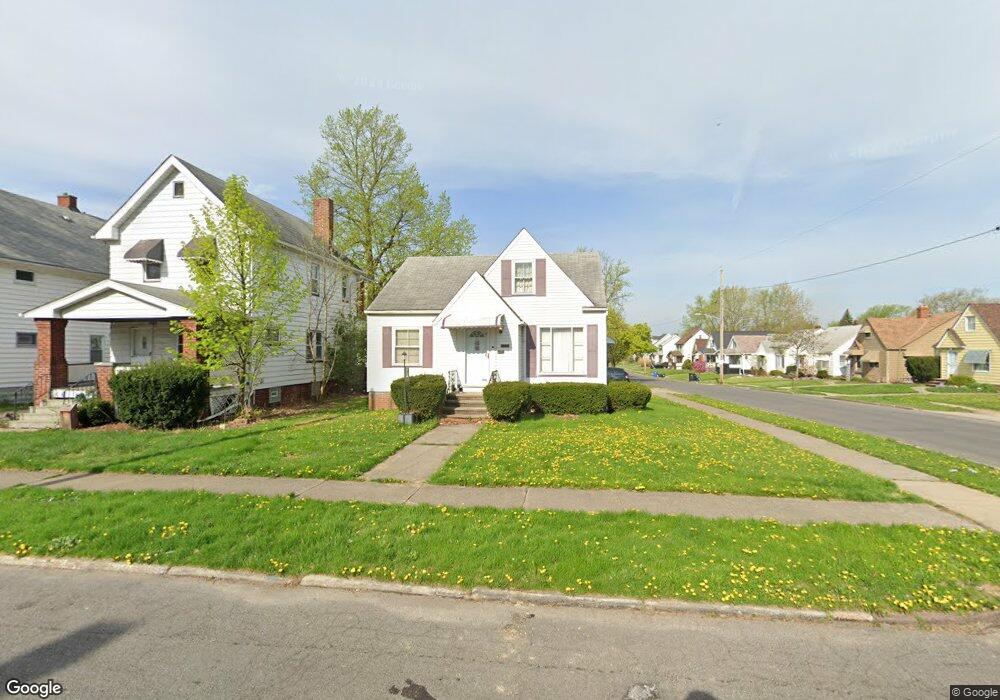
4606 E 93rd St Cleveland, OH 44125
Estimated Value: $112,553 - $151,000
3
Beds
1
Bath
1,338
Sq Ft
$96/Sq Ft
Est. Value
About This Home
This home is located at 4606 E 93rd St, Cleveland, OH 44125 and is currently estimated at $128,138, approximately $95 per square foot. 4606 E 93rd St is a home located in Cuyahoga County with nearby schools including Garfield Heights High School, North Shore High School, and Holy Name Elementary School.
Ownership History
Date
Name
Owned For
Owner Type
Purchase Details
Closed on
Jul 31, 2006
Sold by
Cartus Corp
Bought by
Walker Shnea
Current Estimated Value
Home Financials for this Owner
Home Financials are based on the most recent Mortgage that was taken out on this home.
Original Mortgage
$108,792
Outstanding Balance
$65,353
Interest Rate
6.77%
Mortgage Type
FHA
Estimated Equity
$62,785
Purchase Details
Closed on
Jul 18, 2006
Sold by
Dubecky Erik P and Dubecky Marianne
Bought by
Cartus Financial Corp
Home Financials for this Owner
Home Financials are based on the most recent Mortgage that was taken out on this home.
Original Mortgage
$108,792
Outstanding Balance
$65,353
Interest Rate
6.77%
Mortgage Type
FHA
Estimated Equity
$62,785
Purchase Details
Closed on
May 6, 2001
Sold by
Seneski Irene and Seneski Lawrence
Bought by
Dubecky Erik P
Home Financials for this Owner
Home Financials are based on the most recent Mortgage that was taken out on this home.
Original Mortgage
$79,900
Interest Rate
6.99%
Mortgage Type
FHA
Purchase Details
Closed on
Nov 6, 1978
Sold by
Seneski Ben and Seneski Irene
Bought by
Seneski Ben
Purchase Details
Closed on
Jan 1, 1975
Bought by
Seneski Ben and Seneski Irene
Create a Home Valuation Report for This Property
The Home Valuation Report is an in-depth analysis detailing your home's value as well as a comparison with similar homes in the area
Home Values in the Area
Average Home Value in this Area
Purchase History
| Date | Buyer | Sale Price | Title Company |
|---|---|---|---|
| Walker Shnea | $110,500 | Fidelity | |
| Cartus Financial Corp | $110,500 | Fidelity | |
| Dubecky Erik P | $87,500 | Ohio Title Corporation | |
| Seneski Ben | -- | -- | |
| Seneski Ben | -- | -- |
Source: Public Records
Mortgage History
| Date | Status | Borrower | Loan Amount |
|---|---|---|---|
| Open | Walker Shnea | $108,792 | |
| Previous Owner | Dubecky Erik P | $79,900 |
Source: Public Records
Tax History
| Year | Tax Paid | Tax Assessment Tax Assessment Total Assessment is a certain percentage of the fair market value that is determined by local assessors to be the total taxable value of land and additions on the property. | Land | Improvement |
|---|---|---|---|---|
| 2024 | $4,111 | $39,970 | $9,345 | $30,625 |
| 2023 | $2,990 | $26,540 | $6,410 | $20,130 |
| 2022 | $2,943 | $26,530 | $6,410 | $20,130 |
| 2021 | $3,108 | $26,530 | $6,410 | $20,130 |
| 2020 | $2,673 | $21,210 | $5,110 | $16,100 |
| 2019 | $2,650 | $60,600 | $14,600 | $46,000 |
| 2018 | $2,751 | $21,210 | $5,110 | $16,100 |
| 2017 | $2,582 | $19,360 | $4,060 | $15,300 |
| 2016 | $2,619 | $19,360 | $4,060 | $15,300 |
| 2015 | $2,878 | $19,360 | $4,060 | $15,300 |
| 2014 | $2,878 | $23,600 | $4,940 | $18,660 |
Source: Public Records
Map
Nearby Homes
- 4643 E 90th St
- 4658 E 88th St
- 4690 E 90th St
- 4666 E 86th St
- 4729 E 90th St
- 4550 Effie Rd
- 4723 E 94th St
- 4494 Turney Rd
- 9435 Dorothy Ave
- 8606 Vineyard Ave
- 9509 Rosewood Ave
- 4748 E 94th St
- 8910 Jeffries Ave
- 8420 Vineyard Ave
- 9722 Robinson Ave
- 9809 Sladden Ave
- 8511 Jeffries Ave
- 8119 Bancroft Ave
- 8304 Garfield Blvd
- 4420 Archer Rd
- 4610 E 93rd St
- 4614 E 93rd St
- 4614 E 93rd St Unit Back
- 4614 E 93rd St Unit Down
- 4614 E 93rd St Unit Up
- 4618 E 93rd St
- 4620 E 93rd St
- 4618 4620 E 93 St
- 9304 Grand Division Ave
- 4605 E 90th St
- 9205 Grand Division Ave
- 4609 E 90th St
- 9201 Grand Division Ave
- 9209 Grand Division Ave
- 9109 Grand Division Ave
- 4622 E 93rd St
- 4615 E 90th St
- 9213 Grand Division Ave
- 9308 Grand Division Ave
- 9105 Grand Division Ave
Your Personal Tour Guide
Ask me questions while you tour the home.