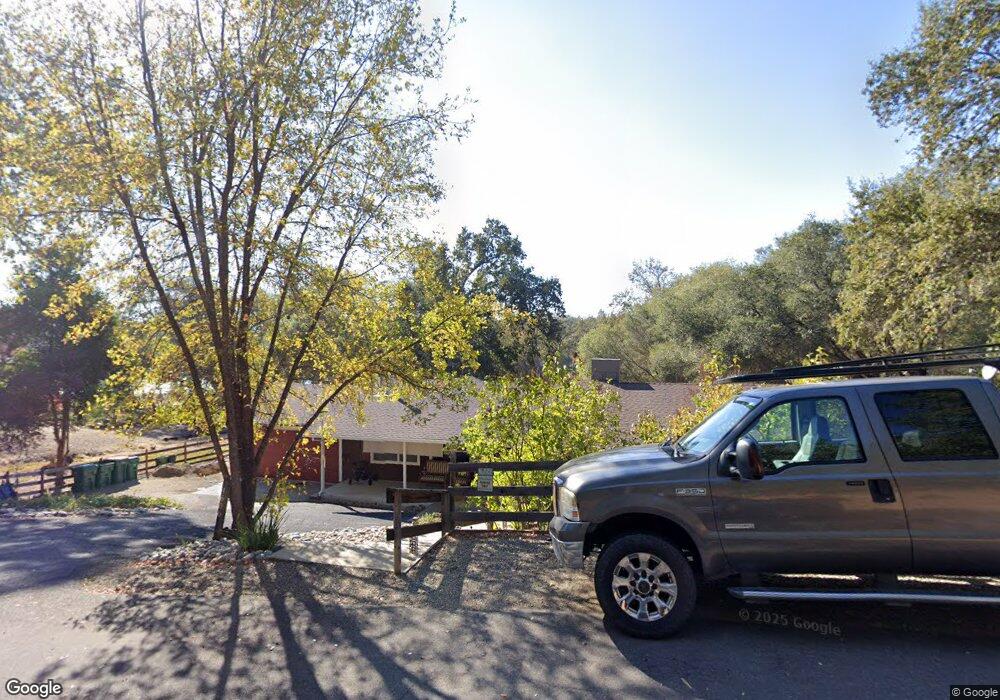
4606 Foothill Dr Shingle Springs, CA 95682
Estimated Value: $560,069 - $842,000
3
Beds
2
Baths
1,551
Sq Ft
$428/Sq Ft
Est. Value
About This Home
This home is located at 4606 Foothill Dr, Shingle Springs, CA 95682 and is currently estimated at $664,017, approximately $428 per square foot. 4606 Foothill Dr is a home located in El Dorado County with nearby schools including Buckeye Elementary School, Camerado Springs Middle School, and Ponderosa High School.
Ownership History
Date
Name
Owned For
Owner Type
Purchase Details
Closed on
Feb 20, 2018
Sold by
Gish Marty R and Griffiths Gish Linda
Bought by
Mcmahan Richard and Mcmahan Cheri
Current Estimated Value
Purchase Details
Closed on
Apr 24, 2003
Sold by
Gish Marty R
Bought by
Gish Marty R and Griffiths Gish Linda
Purchase Details
Closed on
Dec 24, 1998
Sold by
Newton Bob R and Newton Karen R
Bought by
Gish Marty R
Home Financials for this Owner
Home Financials are based on the most recent Mortgage that was taken out on this home.
Original Mortgage
$172,900
Interest Rate
6.82%
Purchase Details
Closed on
Nov 11, 1994
Sold by
Chasin Eugene Steven and Chasin Susan Diane
Bought by
Newton Bob R and Newton Karen R
Home Financials for this Owner
Home Financials are based on the most recent Mortgage that was taken out on this home.
Original Mortgage
$161,500
Interest Rate
8.91%
Create a Home Valuation Report for This Property
The Home Valuation Report is an in-depth analysis detailing your home's value as well as a comparison with similar homes in the area
Home Values in the Area
Average Home Value in this Area
Purchase History
| Date | Buyer | Sale Price | Title Company |
|---|---|---|---|
| Mcmahan Richard | $577,500 | Placer Title Company | |
| Gish Marty R | -- | -- | |
| Gish Marty R | $182,000 | Financial Title Company | |
| Newton Bob R | $170,000 | Placer Title Company |
Source: Public Records
Mortgage History
| Date | Status | Borrower | Loan Amount |
|---|---|---|---|
| Previous Owner | Gish Marty R | $172,900 | |
| Previous Owner | Newton Bob R | $161,500 |
Source: Public Records
Tax History Compared to Growth
Tax History
| Year | Tax Paid | Tax Assessment Tax Assessment Total Assessment is a certain percentage of the fair market value that is determined by local assessors to be the total taxable value of land and additions on the property. | Land | Improvement |
|---|---|---|---|---|
| 2025 | $2,163 | $180,241 | $118,090 | $62,151 |
| 2024 | $2,163 | $176,708 | $115,775 | $60,933 |
| 2023 | $2,126 | $173,244 | $113,505 | $59,739 |
| 2022 | $2,098 | $169,848 | $111,280 | $58,568 |
| 2021 | $2,073 | $166,519 | $109,099 | $57,420 |
| 2020 | $2,050 | $164,813 | $107,981 | $56,832 |
| 2019 | $2,022 | $161,582 | $105,864 | $55,718 |
| 2018 | $2,941 | $250,738 | $89,546 | $161,192 |
| 2017 | $2,746 | $245,823 | $87,791 | $158,032 |
| 2016 | $2,707 | $241,004 | $86,070 | $154,934 |
| 2015 | $2,703 | $237,385 | $84,778 | $152,607 |
| 2014 | $2,703 | $232,737 | $83,118 | $149,619 |
Source: Public Records
Map
Nearby Homes
- 4413 Vega Loop
- 4121 Shingle Springs Dr
- 0 Cutty Sark Ln
- 4225 Creekside Dr
- 4231 Idle Creek Dr
- 4285 Clare Dr
- 4290 Idle Creek Dr
- 4370 Hillwood Dr
- 4706 Hillwood Dr
- 3449 N Shingle Rd
- 4700 Old French Town Rd
- 4700 Old French Town Rd Unit 85
- 4700 Old French Town Rd Unit 94
- 4700 Old French Town Rd Unit 64
- 4700 Old French Town Rd Unit 23
- 4101 Panadero Dr
- 4460 Fawn St
- 4570 Woodside Way
- 3790 Ponderosa Rd
- 5520 Mother Lode Dr
- 4590 Foothill Dr
- Lot 18 Foothill Dr
- 4603 Foothill Dr
- 4620 Foothill Dr
- 4619 Foothill Dr
- 4589 Foothill Dr
- 4576 Foothill Dr
- 4638 Foothill Dr
- 4633 Foothill Dr
- 4606 Ridge Dr
- 4575 Foothill Dr
- 4590 Ridge Dr
- 4620 Ridge Dr
- 4566 Foothill Dr
- 134 ACS Ridge Dr
- 4655 Foothill Dr
- 4636 Ridge Dr
- 4580 Ridge Dr
- 4650 Foothill Dr
- 4556 Foothill Dr