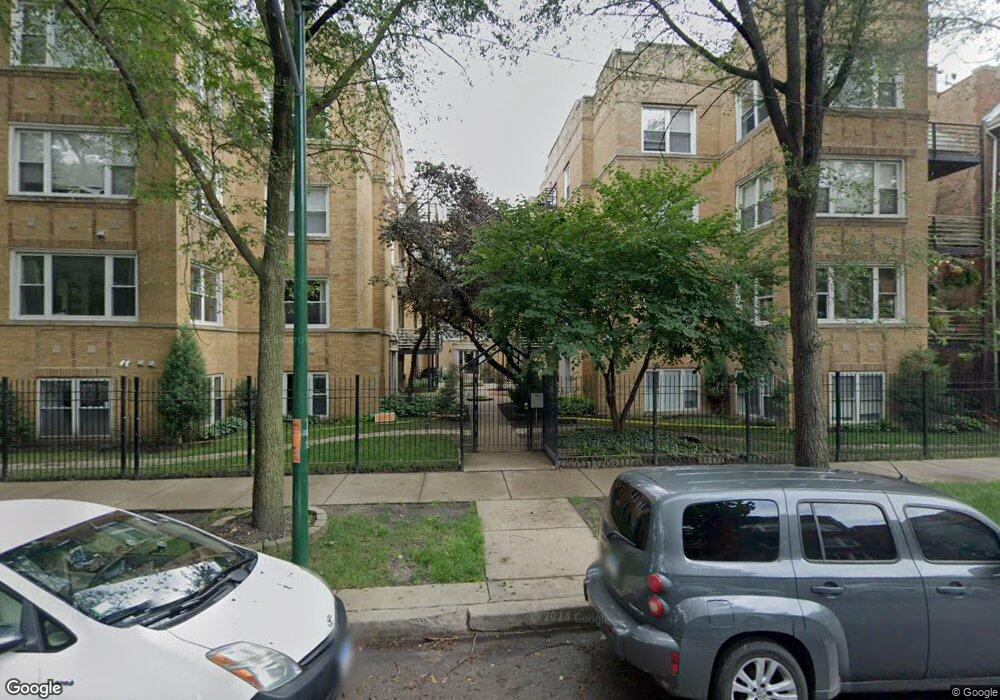
4606 N Monticello Ave Unit 4606 Chicago, IL 60625
Albany Park NeighborhoodEstimated Value: $176,082 - $210,000
1
Bed
1
Bath
--
Sq Ft
0.3
Acres
About This Home
This home is located at 4606 N Monticello Ave Unit 4606, Chicago, IL 60625 and is currently estimated at $188,021. 4606 N Monticello Ave Unit 4606 is a home located in Cook County with nearby schools including Haugan Elementary School, Roosevelt High School, and ASPIRA Haugan Middle School.
Ownership History
Date
Name
Owned For
Owner Type
Purchase Details
Closed on
Nov 15, 2010
Sold by
Hengelmann Michael
Bought by
Goodman Chicago Condos Llc
Current Estimated Value
Purchase Details
Closed on
May 24, 2006
Sold by
Terry Megan M
Bought by
Hengelmann Michael
Home Financials for this Owner
Home Financials are based on the most recent Mortgage that was taken out on this home.
Original Mortgage
$162,000
Interest Rate
6.66%
Mortgage Type
Fannie Mae Freddie Mac
Purchase Details
Closed on
Sep 27, 2004
Sold by
Monticello Vl Development Llc
Bought by
Terry Megan M
Home Financials for this Owner
Home Financials are based on the most recent Mortgage that was taken out on this home.
Original Mortgage
$119,200
Interest Rate
5.5%
Mortgage Type
Unknown
Create a Home Valuation Report for This Property
The Home Valuation Report is an in-depth analysis detailing your home's value as well as a comparison with similar homes in the area
Home Values in the Area
Average Home Value in this Area
Purchase History
| Date | Buyer | Sale Price | Title Company |
|---|---|---|---|
| Goodman Chicago Condos Llc | $47,000 | None Available | |
| Hengelmann Michael | $162,000 | Lawyers | |
| Terry Megan M | $149,000 | Multiple |
Source: Public Records
Mortgage History
| Date | Status | Borrower | Loan Amount |
|---|---|---|---|
| Open | Goodman Chicago Condos Llc | $5,350,000 | |
| Previous Owner | Hengelmann Michael | $162,000 | |
| Previous Owner | Terry Megan M | $119,200 | |
| Previous Owner | Terry Megan M | $21,300 |
Source: Public Records
Tax History Compared to Growth
Tax History
| Year | Tax Paid | Tax Assessment Tax Assessment Total Assessment is a certain percentage of the fair market value that is determined by local assessors to be the total taxable value of land and additions on the property. | Land | Improvement |
|---|---|---|---|---|
| 2024 | $2,541 | $16,439 | $1,139 | $15,300 |
| 2023 | $2,477 | $12,000 | $911 | $11,089 |
| 2022 | $2,477 | $12,000 | $911 | $11,089 |
| 2021 | $2,421 | $11,999 | $911 | $11,088 |
| 2020 | $1,033 | $4,621 | $471 | $4,150 |
| 2019 | $1,044 | $5,179 | $471 | $4,708 |
| 2018 | $1,026 | $5,179 | $471 | $4,708 |
| 2017 | $1,436 | $6,647 | $423 | $6,224 |
| 2016 | $1,336 | $6,647 | $423 | $6,224 |
| 2015 | $1,222 | $6,647 | $423 | $6,224 |
| 2014 | $1,362 | $7,316 | $390 | $6,926 |
| 2013 | $1,335 | $7,316 | $390 | $6,926 |
Source: Public Records
Map
Nearby Homes
- 4604 N Monticello Ave Unit 3E
- 4610 N Monticello Ave Unit 3E
- 4621 N Monticello Ave
- 3721 W Sunnyside Ave
- 4515 N Hamlin Ave
- 4634 N Hamlin Ave
- 4606 N Saint Louis Ave
- 4534 N Saint Louis Ave
- 4530 N Saint Louis Ave
- 4734 N Drake Ave
- 4426 N Drake Ave
- 4435 N Avers Ave
- 4614 N Springfield Ave
- 4624 N Springfield Ave
- 4834 N Ridgeway Ave
- 3816 W Montrose Ave
- 4720 N Springfield Ave
- 4505 N Harding Ave
- 3708 W Ainslie St Unit 2
- 4855 N Drake Ave Unit 2
- 4606 N Monticello Ave Unit 4606
- 4606 N Monticello Ave Unit 4606
- 4606 N Monticello Ave Unit 4606
- 4606 N Monticello Ave Unit 4606
- 4606 N Monticello Ave Unit 4606
- 4606 N Monticello Ave Unit 3N
- 4606 N Monticello Ave Unit 2N
- 4606 N Monticello Ave Unit 3S
- 4606 N Monticello Ave Unit 1S
- 4606 N Monticello Ave Unit 1N
- 4606 N Monticello Ave
- 4608 N Monticello Ave Unit 4608
- 4608 N Monticello Ave Unit 4608
- 4608 N Monticello Ave Unit 4608
- 4608 N Monticello Ave Unit 4608
- 4608 N Monticello Ave Unit 4608
- 4608 N Monticello Ave Unit 4608
- 4608 N Monticello Ave Unit 4608
- 4608 N Monticello Ave Unit GE
- 4608 N Monticello Ave Unit 3