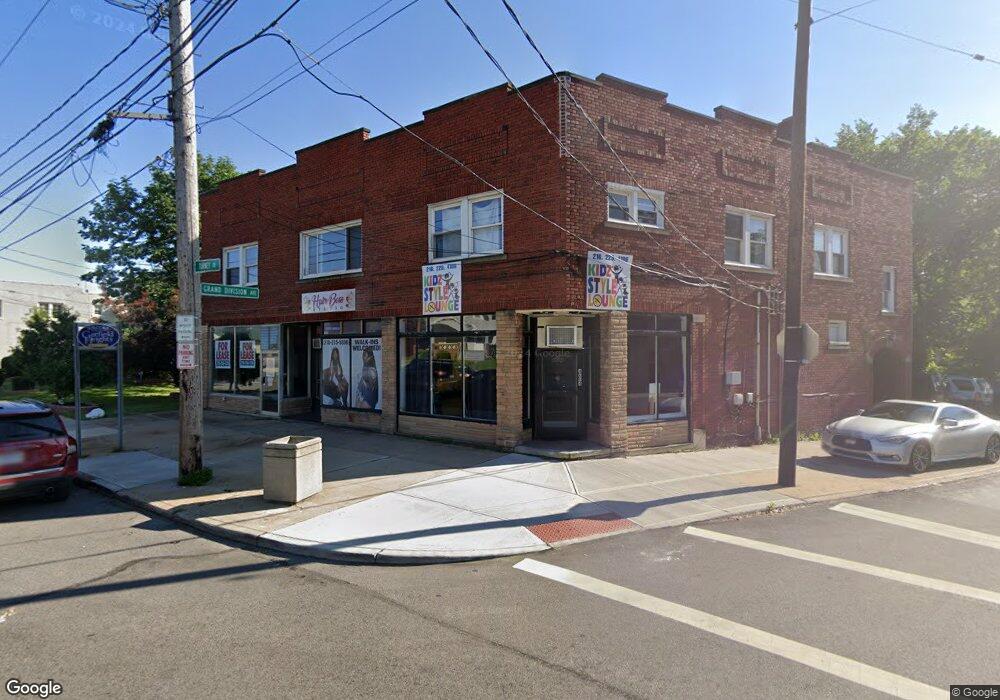
4606 Turney Rd Cleveland, OH 44125
Estimated Value: $349,767
--
Bed
2
Baths
8,459
Sq Ft
$41/Sq Ft
Est. Value
About This Home
This home is located at 4606 Turney Rd, Cleveland, OH 44125 and is currently estimated at $349,767, approximately $41 per square foot. 4606 Turney Rd is a home located in Cuyahoga County with nearby schools including Garfield Heights High School, North Shore High School, and Holy Name Elementary School.
Ownership History
Date
Name
Owned For
Owner Type
Purchase Details
Closed on
Jul 15, 2024
Sold by
Genesis Grace Llc
Bought by
Jai Mata Di Properties Llc
Current Estimated Value
Purchase Details
Closed on
Mar 4, 2019
Sold by
Gpps Management Co Llc
Bought by
Genesis Grace Llc
Home Financials for this Owner
Home Financials are based on the most recent Mortgage that was taken out on this home.
Original Mortgage
$88,000
Interest Rate
4.4%
Mortgage Type
Commercial
Purchase Details
Closed on
Dec 18, 2014
Sold by
Patel Gautam C and Shah Pankil
Bought by
Gpps Management Company Llc
Purchase Details
Closed on
Nov 25, 2014
Sold by
Peters James
Bought by
Patel Gautam C and Shah Pankil
Purchase Details
Closed on
Aug 26, 1992
Sold by
Peters Lillian and Peters Theresa
Bought by
Peters Charles
Purchase Details
Closed on
Jan 1, 1975
Bought by
Peters Lillian and Peters Theresa
Create a Home Valuation Report for This Property
The Home Valuation Report is an in-depth analysis detailing your home's value as well as a comparison with similar homes in the area
Home Values in the Area
Average Home Value in this Area
Purchase History
| Date | Buyer | Sale Price | Title Company |
|---|---|---|---|
| Jai Mata Di Properties Llc | $335,000 | Cle Title | |
| Genesis Grace Llc | $100,000 | Signature Title | |
| Gpps Management Company Llc | -- | Revere Title | |
| Patel Gautam C | $52,500 | Signature Title | |
| Peters Charles | -- | -- | |
| Peters Lillian | -- | -- |
Source: Public Records
Mortgage History
| Date | Status | Borrower | Loan Amount |
|---|---|---|---|
| Previous Owner | Genesis Grace Llc | $88,000 |
Source: Public Records
Tax History Compared to Growth
Tax History
| Year | Tax Paid | Tax Assessment Tax Assessment Total Assessment is a certain percentage of the fair market value that is determined by local assessors to be the total taxable value of land and additions on the property. | Land | Improvement |
|---|---|---|---|---|
| 2024 | $4,917 | $42,490 | $7,805 | $34,685 |
| 2023 | $4,180 | $35,010 | $8,580 | $26,430 |
| 2022 | $4,119 | $35,000 | $8,575 | $26,425 |
| 2021 | $4,384 | $35,000 | $8,580 | $26,430 |
| 2020 | $3,107 | $24,220 | $7,810 | $16,420 |
| 2019 | $3,083 | $69,200 | $22,300 | $46,900 |
| 2018 | $3,213 | $24,220 | $7,810 | $16,420 |
| 2017 | $2,505 | $18,380 | $6,860 | $11,520 |
| 2016 | $2,548 | $18,380 | $6,860 | $11,520 |
| 2015 | $6,708 | $18,380 | $6,860 | $11,520 |
| 2014 | $6,708 | $54,080 | $7,810 | $46,270 |
Source: Public Records
Map
Nearby Homes
- 9412 Grand Division Ave
- 9507 Bohning Dr
- 9500 Cardwell Ave
- 9722 Robinson Ave
- 9005 Grand Division Ave
- 9435 Dorothy Ave
- 4729 E 90th St
- 4684 E 88th St
- 10000 Greenview Ave
- 10105 Greenview Ave
- 4646 E 86th St
- 9101 Jeffries Ave
- 8713 Vineyard Ave
- 10204 Parkview Ave
- 10201 Greenview Ave
- 10217 Parkview Ave
- 4769 E 90th St
- 4420 Archer Rd
- 4762 E 90th St
- 4695 E 85th St
- 4608 Turney Rd
- 4604 Turney Rd Unit 2
- 4604 Turney Rd
- 9521 Grand Division Ave Unit 2
- 9521 Grand Division Ave Unit 7
- 4616 Turney Rd
- 9422 Grand Division Ave
- 9505 Sladden Ave
- 4592 Turney Rd Unit 9
- 4600 Turney Rd Unit 1
- 4609 Turney Rd
- 4601 Turney Rd
- 4597 Turney Rd
- 4611 Turney Rd
- 4617 Turney Rd
- 9501 Sladden Ave
- 9416 Grand Division Ave
- 9421 Sladden Ave
- 9515 Grand Division Ave
- 9605 Sladden Ave