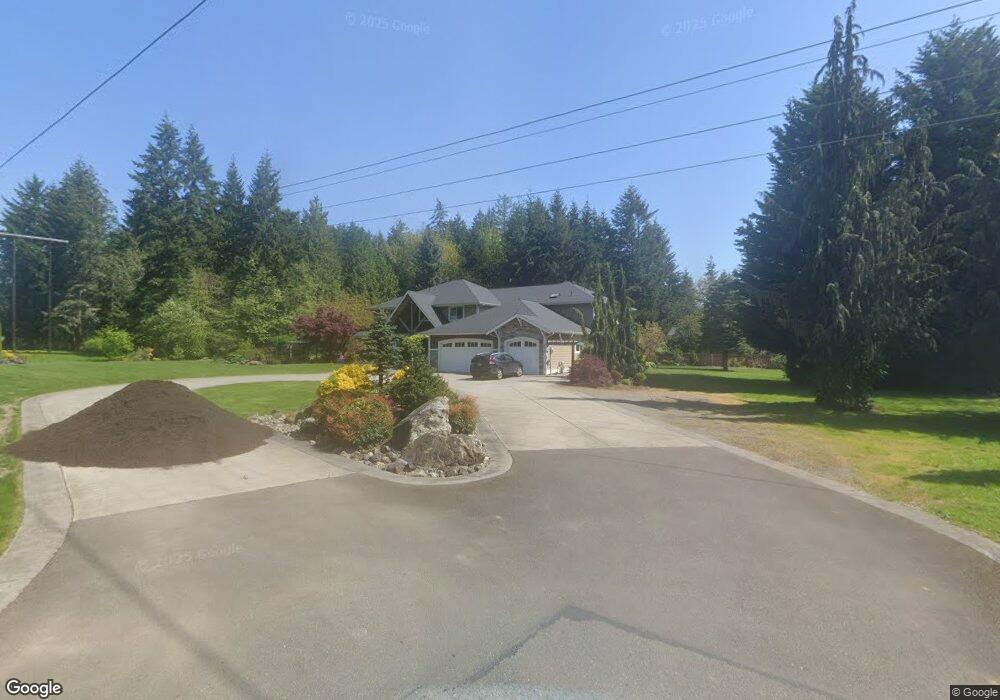
4607 236th Place SE Bothell, WA 98021
North Creek NeighborhoodEstimated Value: $1,892,945 - $2,051,000
5
Beds
5
Baths
4,494
Sq Ft
$439/Sq Ft
Est. Value
About This Home
This home is located at 4607 236th Place SE, Bothell, WA 98021 and is currently estimated at $1,973,648, approximately $439 per square foot. 4607 236th Place SE is a home with nearby schools including Kokanee Elementary School, Leota Middle School, and North Creek High School.
Ownership History
Date
Name
Owned For
Owner Type
Purchase Details
Closed on
Jan 30, 2017
Sold by
Sebranke Brad
Bought by
Sebranke Brad M and Sebranke Brenda L
Current Estimated Value
Home Financials for this Owner
Home Financials are based on the most recent Mortgage that was taken out on this home.
Original Mortgage
$417,000
Outstanding Balance
$341,238
Interest Rate
4.3%
Mortgage Type
New Conventional
Estimated Equity
$1,632,410
Purchase Details
Closed on
Jan 16, 2013
Sold by
Snohomish County
Bought by
Sebranke Brad
Purchase Details
Closed on
Dec 6, 1996
Sold by
Trammell Elmer G and Trammell Ella L
Bought by
Malean Richard R and Malean Tina M
Home Financials for this Owner
Home Financials are based on the most recent Mortgage that was taken out on this home.
Original Mortgage
$133,947
Interest Rate
7.76%
Mortgage Type
FHA
Create a Home Valuation Report for This Property
The Home Valuation Report is an in-depth analysis detailing your home's value as well as a comparison with similar homes in the area
Home Values in the Area
Average Home Value in this Area
Purchase History
| Date | Buyer | Sale Price | Title Company |
|---|---|---|---|
| Sebranke Brad M | -- | Nextitle | |
| Sebranke Brad | $337,078 | None Available | |
| Malean Richard R | $135,555 | Fidelity National Title |
Source: Public Records
Mortgage History
| Date | Status | Borrower | Loan Amount |
|---|---|---|---|
| Open | Sebranke Brad M | $417,000 | |
| Previous Owner | Malean Richard R | $133,947 |
Source: Public Records
Tax History
| Year | Tax Paid | Tax Assessment Tax Assessment Total Assessment is a certain percentage of the fair market value that is determined by local assessors to be the total taxable value of land and additions on the property. | Land | Improvement |
|---|---|---|---|---|
| 2026 | $13,245 | $1,616,500 | $764,300 | $852,200 |
| 2025 | $12,806 | $1,512,800 | $693,100 | $819,700 |
| 2024 | $12,806 | $1,464,000 | $672,000 | $792,000 |
| 2023 | $11,260 | $1,434,000 | $643,500 | $790,500 |
| 2022 | $11,127 | $1,126,700 | $453,500 | $673,200 |
| 2020 | $9,998 | $955,500 | $375,300 | $580,200 |
| 2019 | $9,460 | $919,400 | $344,700 | $574,700 |
| 2018 | $9,047 | $819,500 | $299,700 | $519,800 |
| 2017 | $7,207 | $665,900 | $236,700 | $429,200 |
| 2016 | $4,875 | $427,200 | $209,700 | $217,500 |
| 2015 | $2,548 | $208,400 | $205,200 | $3,200 |
| 2013 | $1,963 | $141,500 | $137,700 | $3,800 |
Source: Public Records
Map
Nearby Homes
- 4422 237th Place SE
- 23718 43rd Dr SE
- 4418 242nd Place SE
- 24228 47th Ave SE
- 3926 243rd Place SE Unit H101
- 3901 243rd Place SE Unit O302
- 3915 243rd Place SE Unit K101
- 22820 41st Dr SE
- 3914 243rd Place SE Unit L301
- 12012 NE 204th Place Unit C203
- 4215 228th St SE
- 12023 NE 204th Place Unit E302
- 12023 NE 204th Place Unit E303
- 22724 41st Dr SE
- 23743 35th Dr SE Unit 40
- 23962 35th Dr SE Unit 36
- 3516 237th St SE Unit 46
- 23736 35th Dr SE
- 23736 35th Dr SE Unit 42
- 3508 237th St SE Unit 47
- 4519 236th Place SE
- 4629 236th Place SE
- 4517 236th Place SE
- 4516 236th Place SE
- 23517 45th Ave SE
- 4630 236th Place SE
- 23615 45th Ave SE
- 23605 45th Ave SE
- 23629 45th Ave SE
- 4703 236th Place SE
- 4704 236th Place SE
- 23701 45th Ave SE
- 23715 45th Ave SE
- 4711 236th Place SE
- 4430 228th Place SE Unit MC1
- 4415 228th Place SE Unit MC17
- 4422 228th Place SE Unit 3
- 4410 228th Place SE Unit 6
- 4427 228th Place SE Unit 20
- 4712 236th Place SE
Your Personal Tour Guide
Ask me questions while you tour the home.