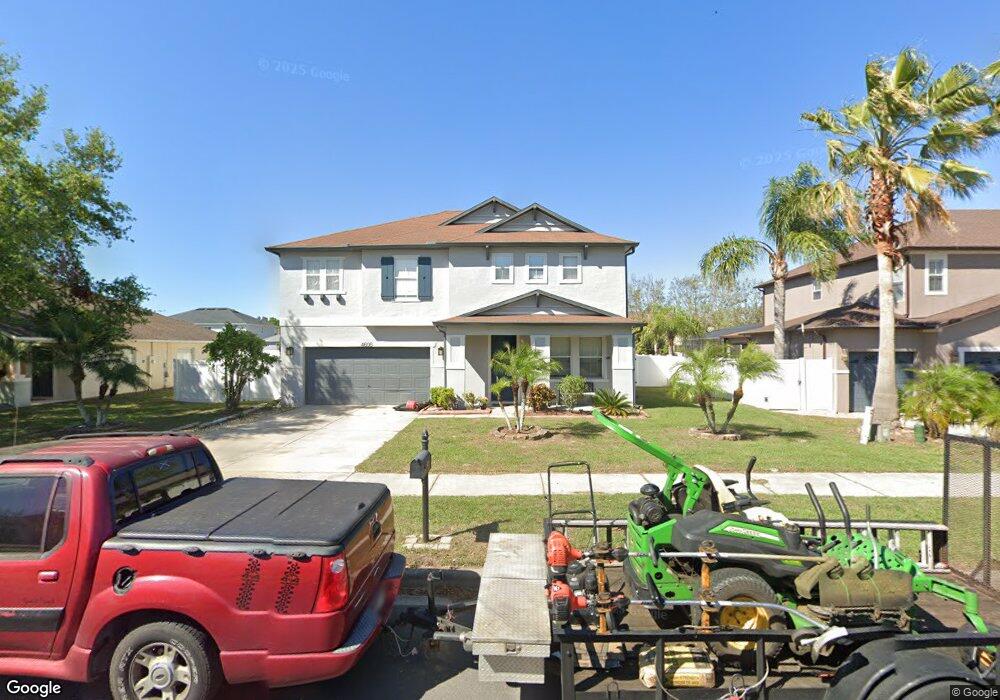
4608 Barbados Loop Clermont, FL 34711
Estimated Value: $450,052 - $518,000
3
Beds
3
Baths
3,175
Sq Ft
$153/Sq Ft
Est. Value
About This Home
This home is located at 4608 Barbados Loop, Clermont, FL 34711 and is currently estimated at $486,013, approximately $153 per square foot. 4608 Barbados Loop is a home located in Lake County with nearby schools including Lost Lake Elementary School, Windy Hill Middle School, and East Ridge High School.
Ownership History
Date
Name
Owned For
Owner Type
Purchase Details
Closed on
Aug 21, 2010
Sold by
Ace Angela
Bought by
Ace John
Current Estimated Value
Purchase Details
Closed on
Jan 4, 2010
Sold by
The Bank Of New York Mellon
Bought by
Ace John and Ace Angela
Home Financials for this Owner
Home Financials are based on the most recent Mortgage that was taken out on this home.
Original Mortgage
$173,469
Outstanding Balance
$112,920
Interest Rate
4.94%
Mortgage Type
New Conventional
Estimated Equity
$373,093
Purchase Details
Closed on
Aug 24, 2009
Sold by
Gomez Maria and Gomez Jose B
Bought by
The Bank Of New York
Purchase Details
Closed on
Aug 11, 2009
Sold by
Gomez Maria and Gomez Jose B
Bought by
The Bank Of New York
Purchase Details
Closed on
Sep 25, 2006
Sold by
Kb Home Orlando Llc
Bought by
Gomez Jose B and Gomez Maria
Home Financials for this Owner
Home Financials are based on the most recent Mortgage that was taken out on this home.
Original Mortgage
$314,039
Interest Rate
7.62%
Mortgage Type
New Conventional
Create a Home Valuation Report for This Property
The Home Valuation Report is an in-depth analysis detailing your home's value as well as a comparison with similar homes in the area
Purchase History
| Date | Buyer | Sale Price | Title Company |
|---|---|---|---|
| Ace John | -- | None Available | |
| Ace John | $170,000 | Landsafe Title | |
| The Bank Of New York | -- | Attorney | |
| The Bank Of New York | -- | Attorney | |
| Gomez Jose B | $330,600 | First American Title Ins Co |
Source: Public Records
Mortgage History
| Date | Status | Borrower | Loan Amount |
|---|---|---|---|
| Open | Ace John | $173,469 | |
| Previous Owner | Gomez Jose B | $314,039 |
Source: Public Records
Tax History
| Year | Tax Paid | Tax Assessment Tax Assessment Total Assessment is a certain percentage of the fair market value that is determined by local assessors to be the total taxable value of land and additions on the property. | Land | Improvement |
|---|---|---|---|---|
| 2026 | $5,526 | $428,116 | $100,000 | $328,116 |
| 2025 | $5,038 | $371,545 | $100,000 | $271,545 |
| 2024 | $5,038 | $371,545 | $100,000 | $271,545 |
| 2023 | $5,038 | $327,694 | $100,000 | $227,694 |
| 2022 | $4,485 | $279,451 | $43,000 | $236,451 |
| 2021 | $3,783 | $223,197 | $0 | $0 |
| 2020 | $3,623 | $212,166 | $0 | $0 |
| 2019 | $3,613 | $208,487 | $0 | $0 |
| 2018 | $3,168 | $179,350 | $0 | $0 |
| 2017 | $1,759 | $139,751 | $0 | $0 |
| 2016 | $1,744 | $136,877 | $0 | $0 |
| 2015 | $1,783 | $135,926 | $0 | $0 |
| 2014 | $1,735 | $134,848 | $0 | $0 |
Source: Public Records
Map
Nearby Homes
- 3026 Anquilla Ave
- 3064 Tobago Ave
- 2916 Majestic Isle Dr
- 3106 Anquilla Ave
- 4448 Harts Cove Way
- 2735 Kingston Ridge Dr
- 3643 Peaceful Valley Dr
- 4500 Barrister Dr
- 4724 Cragmere Loop
- 4277 Bugle St
- 3443 Tumbling River Dr
- 3649 Peace Pipe Way
- 4614 Cragmere Loop
- 4653 Cragmere Loop
- 3555 Wind River Run
- 4767 Cragmere Loop
- 4262 Caplock St
- 4542 Lions Gate Ave
- 4507 Davos Dr
- 4484 Lions Gate Ave
- 4612 Barbados Loop
- 4604 Barbados Loop
- 3055 Anquilla Ave
- 4616 Barbados Loop
- 4600 Barbados Loop
- 3051 Anquilla Ave
- 3059 Anquilla Ave
- 4609 Barbados Loop
- 4613 Barbados Loop
- 3047 Anquilla Ave
- 3063 Anquilla Ave
- 4605 Barbados Loop
- 4620 Barbados Loop
- 4596 Barbados Loop
- 4617 Barbados Loop
- 4601 Barbados Loop
- 3043 Anquilla Ave
- 3067 Anquilla Ave
- 4621 Barbados Loop
- 4624 Barbados Loop
Your Personal Tour Guide
Ask me questions while you tour the home.