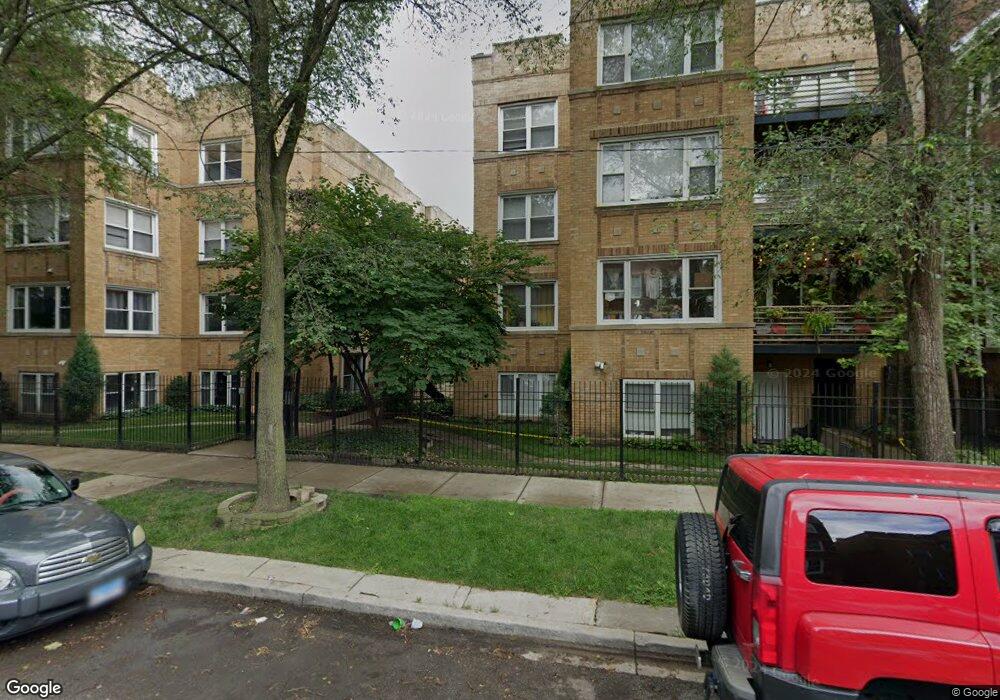
4608 N Monticello Ave Unit 2E Chicago, IL 60625
Albany Park NeighborhoodEstimated Value: $212,000 - $236,000
2
Beds
2
Baths
700
Sq Ft
$321/Sq Ft
Est. Value
About This Home
This home is located at 4608 N Monticello Ave Unit 2E, Chicago, IL 60625 and is currently estimated at $224,752, approximately $321 per square foot. 4608 N Monticello Ave Unit 2E is a home located in Cook County with nearby schools including Haugan Elementary School, Roosevelt High School, and ASPIRA Haugan Middle School.
Ownership History
Date
Name
Owned For
Owner Type
Purchase Details
Closed on
Nov 23, 2022
Sold by
Cappucci Robert J and Palmer John E
Bought by
Mckessy Aleia Joan
Current Estimated Value
Home Financials for this Owner
Home Financials are based on the most recent Mortgage that was taken out on this home.
Original Mortgage
$170,910
Outstanding Balance
$165,649
Interest Rate
6.99%
Mortgage Type
New Conventional
Estimated Equity
$59,103
Purchase Details
Closed on
Apr 28, 2005
Sold by
Monticello Vl Development Llc
Bought by
Cappucci Robert J and Palmer John E
Home Financials for this Owner
Home Financials are based on the most recent Mortgage that was taken out on this home.
Original Mortgage
$151,200
Interest Rate
6.06%
Mortgage Type
Fannie Mae Freddie Mac
Create a Home Valuation Report for This Property
The Home Valuation Report is an in-depth analysis detailing your home's value as well as a comparison with similar homes in the area
Home Values in the Area
Average Home Value in this Area
Purchase History
| Date | Buyer | Sale Price | Title Company |
|---|---|---|---|
| Mckessy Aleia Joan | $190,000 | Jameson Title Services Llc | |
| Cappucci Robert J | $189,000 | Multiple |
Source: Public Records
Mortgage History
| Date | Status | Borrower | Loan Amount |
|---|---|---|---|
| Open | Mckessy Aleia Joan | $170,910 | |
| Previous Owner | Cappucci Robert J | $151,200 |
Source: Public Records
Tax History Compared to Growth
Tax History
| Year | Tax Paid | Tax Assessment Tax Assessment Total Assessment is a certain percentage of the fair market value that is determined by local assessors to be the total taxable value of land and additions on the property. | Land | Improvement |
|---|---|---|---|---|
| 2024 | $2,474 | $20,048 | $1,389 | $18,659 |
| 2023 | $3,096 | $15,000 | $1,111 | $13,889 |
| 2022 | $3,096 | $15,000 | $1,111 | $13,889 |
| 2021 | $3,026 | $14,999 | $1,111 | $13,888 |
| 2020 | $1,252 | $5,637 | $575 | $5,062 |
| 2019 | $1,273 | $6,317 | $575 | $5,742 |
| 2018 | $1,252 | $6,317 | $575 | $5,742 |
| 2017 | $1,751 | $8,106 | $515 | $7,591 |
| 2016 | $1,629 | $8,106 | $515 | $7,591 |
| 2015 | $1,491 | $8,106 | $515 | $7,591 |
| 2014 | $1,662 | $8,923 | $476 | $8,447 |
| 2013 | $1,629 | $8,923 | $476 | $8,447 |
Source: Public Records
Map
Nearby Homes
- 4619 N Lawndale Ave Unit 1
- 4621 N Monticello Ave
- 3733 W Sunnyside Ave
- 4515 N Hamlin Ave
- 4534 N Saint Louis Ave
- 4734 N Drake Ave
- 3711 W Lawrence Ave
- 4426 N Drake Ave
- 3550 W Montrose Ave Unit 107
- 4614 N Springfield Ave
- 4624 N Springfield Ave
- 4602 N Springfield Ave
- 3816 W Montrose Ave
- 4304 N Lawndale Ave
- 3618 W Ainslie St Unit 3W
- 4903 N Monticello Ave Unit 3
- 4900 N Lawndale Ave Unit G
- 3707 W Cullom Ave Unit 1
- 4906 N Drake Ave Unit 3
- 4249 N Central Park Ave
- 4608 N Monticello Ave Unit 4608
- 4608 N Monticello Ave Unit 4608
- 4608 N Monticello Ave Unit 4608
- 4608 N Monticello Ave Unit 4608
- 4608 N Monticello Ave Unit 4608
- 4608 N Monticello Ave Unit 4608
- 4608 N Monticello Ave Unit 4608
- 4608 N Monticello Ave Unit GE
- 4608 N Monticello Ave Unit 3
- 4608 N Monticello Ave Unit 3E
- 4608 N Monticello Ave Unit 2W
- 4608 N Monticello Ave Unit 1E
- 4608 N Monticello Ave Unit G
- 4608 N Monticello Ave Unit 1W
- 4608 N Monticello Ave Unit 2E
- 4606 N Monticello Ave Unit 4606
- 4606 N Monticello Ave Unit 4606
- 4606 N Monticello Ave Unit 4606
- 4606 N Monticello Ave Unit 4606
- 4606 N Monticello Ave Unit 4606