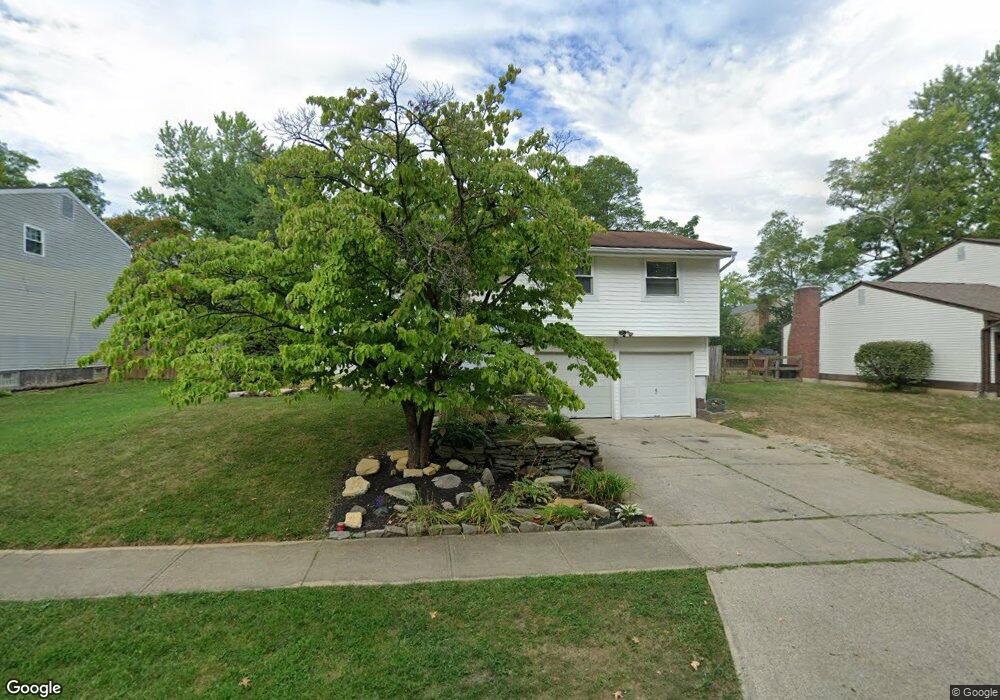
4609 Brookview Dr Batavia, OH 45103
Estimated Value: $245,853 - $273,000
3
Beds
2
Baths
1,504
Sq Ft
$171/Sq Ft
Est. Value
About This Home
This home is located at 4609 Brookview Dr, Batavia, OH 45103 and is currently estimated at $256,463, approximately $170 per square foot. 4609 Brookview Dr is a home located in Clermont County with nearby schools including Willowville Elementary School, West Clermont Middle School, and West Clermont High School.
Ownership History
Date
Name
Owned For
Owner Type
Purchase Details
Closed on
Jun 16, 2023
Sold by
Morano Michelle L and Morano David D
Bought by
Moran Michelle L and Moran David D
Current Estimated Value
Purchase Details
Closed on
Jul 20, 2009
Sold by
Kws Group I Llc
Bought by
Gapinski Michelle L
Home Financials for this Owner
Home Financials are based on the most recent Mortgage that was taken out on this home.
Original Mortgage
$98,090
Interest Rate
5.49%
Mortgage Type
FHA
Purchase Details
Closed on
Mar 16, 2009
Sold by
Proud Kenneth and Proud Sandra
Bought by
Kws Group I Llc
Purchase Details
Closed on
Dec 12, 2005
Sold by
Vaughn David A and Vaughn Liesel
Bought by
Proud Kenneth and Proud Sandra
Home Financials for this Owner
Home Financials are based on the most recent Mortgage that was taken out on this home.
Original Mortgage
$111,200
Interest Rate
10.2%
Mortgage Type
Fannie Mae Freddie Mac
Purchase Details
Closed on
Apr 13, 2004
Sold by
Vaughn David A and Vaughn Liesel
Bought by
Vaughn David A and Vaughn Liesel
Home Financials for this Owner
Home Financials are based on the most recent Mortgage that was taken out on this home.
Original Mortgage
$108,000
Interest Rate
5.48%
Mortgage Type
Purchase Money Mortgage
Purchase Details
Closed on
May 2, 1984
Create a Home Valuation Report for This Property
The Home Valuation Report is an in-depth analysis detailing your home's value as well as a comparison with similar homes in the area
Home Values in the Area
Average Home Value in this Area
Purchase History
| Date | Buyer | Sale Price | Title Company |
|---|---|---|---|
| Moran Michelle L | $125 | None Listed On Document | |
| Gapinski Michelle L | $98,100 | None Available | |
| Kws Group I Llc | -- | None Available | |
| Proud Kenneth | $185,333 | None Available | |
| Vaughn David A | -- | -- | |
| Vaughn David A | -- | Members Title Agency Llc | |
| -- | $53,000 | -- |
Source: Public Records
Mortgage History
| Date | Status | Borrower | Loan Amount |
|---|---|---|---|
| Previous Owner | Gapinski Michelle L | $98,090 | |
| Previous Owner | Proud Kenneth | $111,200 | |
| Previous Owner | Vaughn David A | $108,000 |
Source: Public Records
Tax History
| Year | Tax Paid | Tax Assessment Tax Assessment Total Assessment is a certain percentage of the fair market value that is determined by local assessors to be the total taxable value of land and additions on the property. | Land | Improvement |
|---|---|---|---|---|
| 2024 | $3,210 | $62,200 | $11,410 | $50,790 |
| 2023 | $3,141 | $62,200 | $11,410 | $50,790 |
| 2022 | $2,560 | $43,930 | $8,050 | $35,880 |
| 2021 | $2,570 | $43,930 | $8,050 | $35,880 |
| 2020 | $2,573 | $43,930 | $8,050 | $35,880 |
| 2019 | $2,244 | $44,800 | $11,270 | $33,530 |
| 2018 | $2,267 | $44,800 | $11,270 | $33,530 |
| 2017 | $2,178 | $44,800 | $11,270 | $33,530 |
| 2016 | $2,178 | $38,960 | $9,800 | $29,160 |
| 2015 | $2,113 | $38,960 | $9,800 | $29,160 |
| 2014 | $2,113 | $38,960 | $9,800 | $29,160 |
| 2013 | $2,106 | $38,400 | $9,800 | $28,600 |
Source: Public Records
Map
Nearby Homes
- 4625 Locust Grove Ct
- 4322 Preston Place
- 4565 Shephard Rd
- 1023 Glendale Dr
- 4583 Creekwood Ct
- 4746 Shephard Rd
- 4686 Tealtown Rd
- 14 Tidewater Trace Unit 2207
- 4493 Schoolhouse Rd
- 2 Spotswood Common Unit 2006
- 34 Banberry Trace Unit 1605
- 4488 Glenwillow Dr
- 4503 Eva Ln
- 1178 Mckinley Ct
- 1234 Ben Avon
- 4469 Eva Ln
- 4591 Ellsberry Ct
- 4602 Ellsberry Ct
- 1079 Kensington Ln
- 4442 Meese Dr
- 4607 Brookview Dr
- 4611 Brookview Dr
- 4594 Northridge Dr
- 4596 Northridge Dr
- 4592 Northridge Dr
- 4590 Northridge Dr
- 4598 Northridge Dr
- 4614 Crosswood Ln
- 4605 Brookview Dr
- 4613 Brookview Dr
- 4600 Northridge Dr
- 4616 Crosswood Ln
- 4602 Northridge Dr
- 4604 Northridge Dr
- 4612 Brookview Dr
- 4622 Crosswood Ln
- 4620 Crosswood Ln
- 4608 Brookview Dr
- 4624 Crosswood Ln
- 4603 Brookview Dr
Your Personal Tour Guide
Ask me questions while you tour the home.