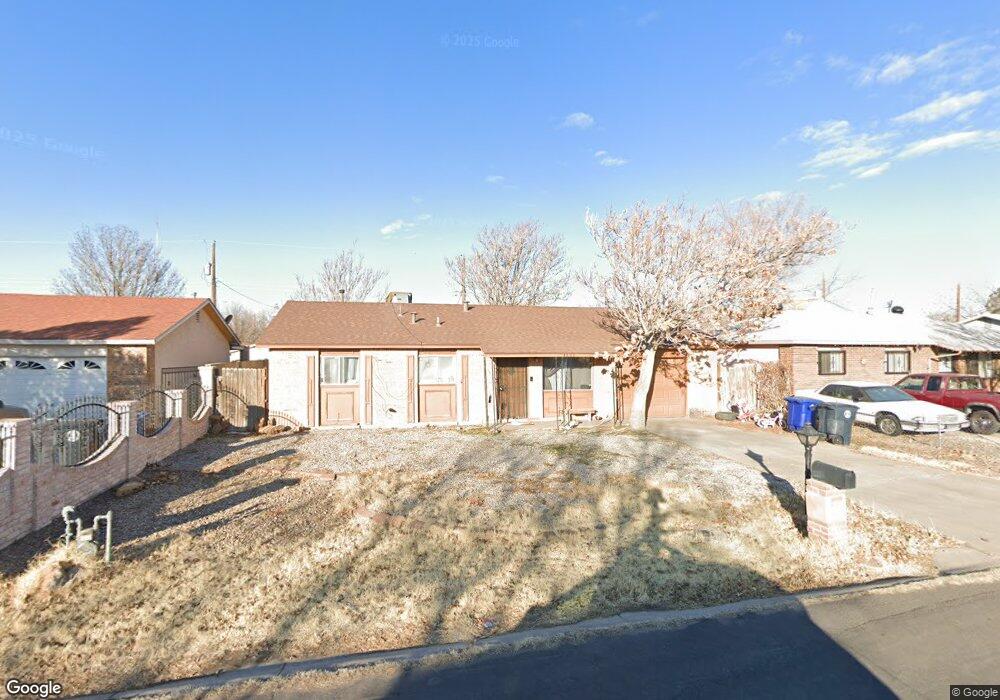
4609 Spring Valley Cir SW Albuquerque, NM 87105
Estimated Value: $238,000 - $269,405
3
Beds
2
Baths
1,200
Sq Ft
$213/Sq Ft
Est. Value
About This Home
This home is located at 4609 Spring Valley Cir SW, Albuquerque, NM 87105 and is currently estimated at $255,351, approximately $212 per square foot. 4609 Spring Valley Cir SW is a home located in Bernalillo County with nearby schools including Navajo Elementary School, Harrison Middle School, and Rio Grande High School.
Ownership History
Date
Name
Owned For
Owner Type
Purchase Details
Closed on
Feb 28, 2006
Sold by
Pegasus Enterprises Llc
Bought by
Pehrson D Wayne and Pehrson Trisha S
Current Estimated Value
Home Financials for this Owner
Home Financials are based on the most recent Mortgage that was taken out on this home.
Original Mortgage
$107,500
Outstanding Balance
$59,979
Interest Rate
6.05%
Mortgage Type
Fannie Mae Freddie Mac
Estimated Equity
$195,372
Purchase Details
Closed on
Nov 8, 2005
Sold by
Realtek Inc
Bought by
Pegasus Enterprises Llc
Purchase Details
Closed on
Oct 27, 2005
Sold by
Omlor Michael A and Omlor Glenna M
Bought by
Realtek Inc
Purchase Details
Closed on
Sep 29, 2005
Sold by
Lira Victor
Bought by
Omior Michael A and Omior Glenna M
Create a Home Valuation Report for This Property
The Home Valuation Report is an in-depth analysis detailing your home's value as well as a comparison with similar homes in the area
Home Values in the Area
Average Home Value in this Area
Purchase History
| Date | Buyer | Sale Price | Title Company |
|---|---|---|---|
| Pehrson D Wayne | -- | First American Title Ins Co | |
| Pegasus Enterprises Llc | -- | First American Title | |
| Realtek Inc | -- | -- | |
| Omior Michael A | $55,151 | -- |
Source: Public Records
Mortgage History
| Date | Status | Borrower | Loan Amount |
|---|---|---|---|
| Open | Pehrson D Wayne | $107,500 |
Source: Public Records
Tax History Compared to Growth
Tax History
| Year | Tax Paid | Tax Assessment Tax Assessment Total Assessment is a certain percentage of the fair market value that is determined by local assessors to be the total taxable value of land and additions on the property. | Land | Improvement |
|---|---|---|---|---|
| 2025 | $1,649 | $35,198 | $8,577 | $26,621 |
| 2024 | $1,649 | $34,173 | $8,327 | $25,846 |
| 2023 | $1,619 | $33,178 | $8,085 | $25,093 |
| 2022 | $1,533 | $32,213 | $7,850 | $24,363 |
| 2021 | $1,483 | $31,274 | $7,621 | $23,653 |
| 2020 | $1,456 | $30,363 | $7,399 | $22,964 |
| 2019 | $1,470 | $30,663 | $7,399 | $23,264 |
| 2018 | $1,462 | $30,663 | $7,399 | $23,264 |
| 2017 | $1,466 | $30,663 | $7,399 | $23,264 |
| 2016 | $1,460 | $30,963 | $7,399 | $23,564 |
| 2015 | $31,263 | $31,263 | $7,399 | $23,864 |
| 2014 | $1,458 | $31,263 | $7,399 | $23,864 |
| 2013 | -- | $31,563 | $7,399 | $24,164 |
Source: Public Records
Map
Nearby Homes
- 4506 W Glen Dr SW
- 2620 Gun Club Rd SW
- 4320 Blumenshine Cir SW
- 5147 Don Mariano Rd SW
- 2408 Alpine Rd SW
- 3445 Gun Club Rd SW
- 3611 Gun Club Rd SW
- 7805B Coors Blvd SW
- 3104 Lisa Rd SW
- 3931 Anderson Farm Dr SW
- 0 Coors Rd SW
- 4625 Sunny Cir SW
- 5621 Don Lorenzo Dr SW
- 2830 Rio Bravo Blvd SW
- 2212 Henry Rd SW
- 0 Off Pajarito (Wf 9 11 12) Rd SW Unit 1057983
- 4321 Mead Ave SW
- 1905 Lakeview Rd SW
- 2621 Del Sur Dr SW
- 2318 Trammell Ct SW
- 4605 Spring Valley Cir SW
- 4613 Spring Valley Cir SW
- 4617 Spring Valley Cir SW
- 4630 W Lea Dr SW
- 4601 Spring Valley Cir SW
- 4608 Spring Valley Cir SW
- 4612 Spring Valley Cir SW
- 4624 W Lea Dr SW
- 4618 W Lea Dr SW
- 4604 Spring Valley Cir SW
- 4636 W Lea Dr SW
- 4545 Spring Valley Cir SW
- 4616 Spring Valley Cir SW
- 4621 Spring Valley Cir SW
- 4600 Spring Valley Cir SW
- 4642 W Lea Dr SW
- 4620 Spring Valley Cir SW
- 4612 W Lea Dr SW
- 4644 W Lea Dr SW
- 4541 Spring Valley Cir SW