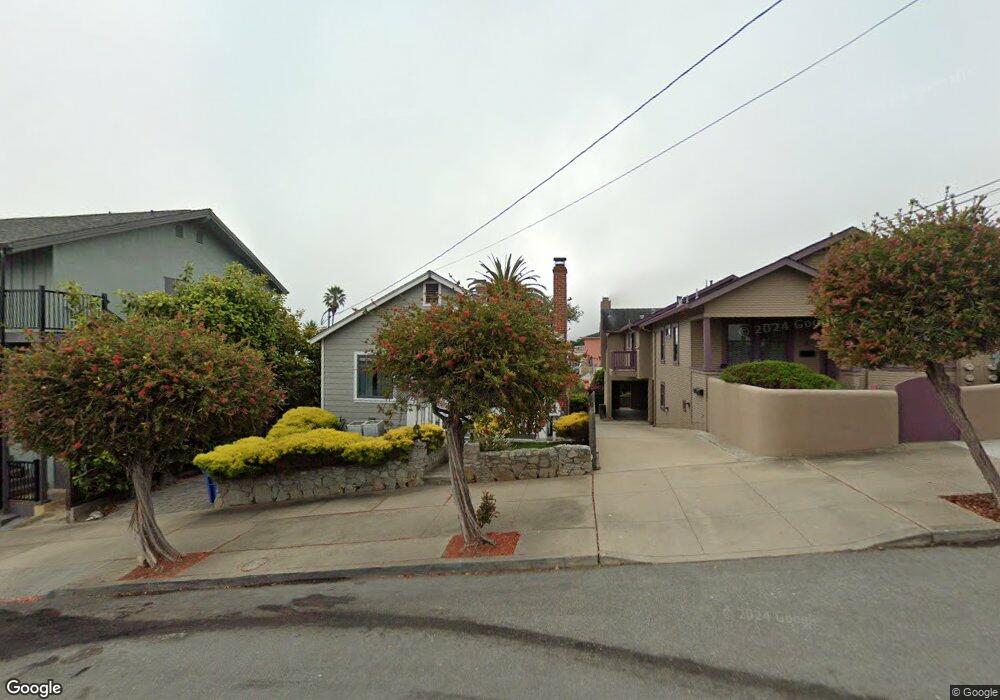
461 Drake Ave Monterey, CA 93940
New Monterey NeighborhoodEstimated Value: $1,114,000 - $1,449,000
3
Beds
2
Baths
1,186
Sq Ft
$1,080/Sq Ft
Est. Value
About This Home
This home is located at 461 Drake Ave, Monterey, CA 93940 and is currently estimated at $1,280,664, approximately $1,079 per square foot. 461 Drake Ave is a home located in Monterey County with nearby schools including Monte Vista Elementary School, Monte Vista Middle School, and Monterey High School.
Ownership History
Date
Name
Owned For
Owner Type
Purchase Details
Closed on
Feb 28, 2024
Sold by
Palmer Sandee Larkin
Bought by
Sandee Larkin Living Trust and Larkin
Current Estimated Value
Purchase Details
Closed on
Mar 29, 2022
Sold by
Larkin Palmer Sandee
Bought by
Palmer Sandee Larkin
Home Financials for this Owner
Home Financials are based on the most recent Mortgage that was taken out on this home.
Original Mortgage
$475,000
Interest Rate
4.42%
Mortgage Type
New Conventional
Purchase Details
Closed on
Sep 11, 2000
Sold by
Powers Dennis A
Bought by
Larkin Sandee
Home Financials for this Owner
Home Financials are based on the most recent Mortgage that was taken out on this home.
Original Mortgage
$449,000
Interest Rate
8.11%
Mortgage Type
Stand Alone First
Purchase Details
Closed on
Dec 10, 1996
Sold by
Hegg Edward A
Bought by
Powers Dennis A
Home Financials for this Owner
Home Financials are based on the most recent Mortgage that was taken out on this home.
Original Mortgage
$96,750
Interest Rate
7.76%
Create a Home Valuation Report for This Property
The Home Valuation Report is an in-depth analysis detailing your home's value as well as a comparison with similar homes in the area
Home Values in the Area
Average Home Value in this Area
Purchase History
| Date | Buyer | Sale Price | Title Company |
|---|---|---|---|
| Sandee Larkin Living Trust | -- | None Listed On Document | |
| Palmer Sandee Larkin | -- | Ticor Title | |
| Larkin Sandee | $449,000 | Stewart Title | |
| Powers Dennis A | $322,500 | Stewart Title |
Source: Public Records
Mortgage History
| Date | Status | Borrower | Loan Amount |
|---|---|---|---|
| Previous Owner | Palmer Sandee Larkin | $475,000 | |
| Previous Owner | Larkin Sandee | $449,000 | |
| Previous Owner | Powers Dennis A | $96,750 | |
| Closed | Powers Dennis A | $161,250 |
Source: Public Records
Tax History Compared to Growth
Tax History
| Year | Tax Paid | Tax Assessment Tax Assessment Total Assessment is a certain percentage of the fair market value that is determined by local assessors to be the total taxable value of land and additions on the property. | Land | Improvement |
|---|---|---|---|---|
| 2025 | $7,341 | $676,556 | $369,168 | $307,388 |
| 2024 | $7,341 | $663,291 | $361,930 | $301,361 |
| 2023 | $7,074 | $650,286 | $354,834 | $295,452 |
| 2022 | $6,975 | $637,536 | $347,877 | $289,659 |
| 2021 | $6,873 | $625,036 | $341,056 | $283,980 |
| 2020 | $6,614 | $618,628 | $337,559 | $281,069 |
| 2019 | $6,937 | $606,499 | $330,941 | $275,558 |
| 2018 | $6,660 | $594,607 | $324,452 | $270,155 |
| 2017 | $6,169 | $582,949 | $318,091 | $264,858 |
| 2016 | $6,058 | $571,519 | $311,854 | $259,665 |
| 2015 | $5,971 | $562,935 | $307,170 | $255,765 |
| 2014 | $5,868 | $551,908 | $301,153 | $250,755 |
Source: Public Records
Map
Nearby Homes
- 481 Drake Ave
- 381 Hawthorne St
- 499 Drake Ave
- 399 Hawthorne St
- 371 Hawthorne St
- 347 Hawthorne St
- 330 Laine St Unit Amazing views
- 345 Hawthorne St Unit 347
- 345 Hawthorne St
- 416 Drake Ave
- 321 Hawthorne St
- 400 Drake Ave Unit 12
- 400 Drake Ave Unit 9
- 400 Drake Ave Unit 8
- 400 Drake Ave Unit 7
- 400 Drake Ave Unit 6
- 400 Drake Ave Unit 5
- 400 Drake Ave Unit 3
- 400 Drake Ave Unit 2
- 400 Drake Ave Unit 4