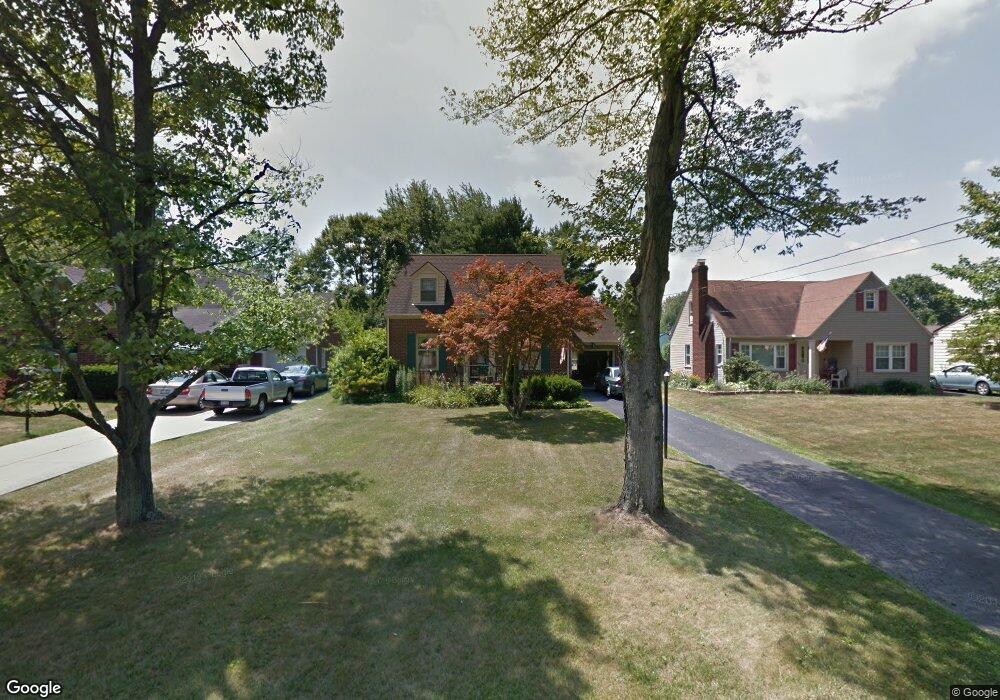
461 Orlo Ln Youngstown, OH 44512
Estimated Value: $146,000 - $165,000
2
Beds
1
Bath
1,195
Sq Ft
$128/Sq Ft
Est. Value
About This Home
This home is located at 461 Orlo Ln, Youngstown, OH 44512 and is currently estimated at $153,463, approximately $128 per square foot. 461 Orlo Ln is a home located in Mahoning County with nearby schools including Robinwood Lane Elementary School, Boardman Glenwood Junior High School, and Boardman High School.
Ownership History
Date
Name
Owned For
Owner Type
Purchase Details
Closed on
Feb 14, 2003
Sold by
Lipka Thomas J and Lipka Kelly A
Bought by
Macejko Andrew
Current Estimated Value
Home Financials for this Owner
Home Financials are based on the most recent Mortgage that was taken out on this home.
Original Mortgage
$57,500
Outstanding Balance
$24,823
Interest Rate
6.06%
Estimated Equity
$128,640
Purchase Details
Closed on
Jul 16, 1997
Sold by
Santor Michael A and Hart Karen J
Bought by
Lipka Thomas J and Lipka Kelly A
Purchase Details
Closed on
Dec 29, 1995
Sold by
Dixon Raymond E
Bought by
Santor Michael A and Hart Karen J
Home Financials for this Owner
Home Financials are based on the most recent Mortgage that was taken out on this home.
Original Mortgage
$55,800
Interest Rate
7.42%
Mortgage Type
New Conventional
Purchase Details
Closed on
Mar 2, 1987
Bought by
Dixon Raymond E
Create a Home Valuation Report for This Property
The Home Valuation Report is an in-depth analysis detailing your home's value as well as a comparison with similar homes in the area
Home Values in the Area
Average Home Value in this Area
Purchase History
| Date | Buyer | Sale Price | Title Company |
|---|---|---|---|
| Macejko Andrew | $72,500 | -- | |
| Lipka Thomas J | $73,000 | -- | |
| Santor Michael A | $62,000 | -- | |
| Dixon Raymond E | -- | -- |
Source: Public Records
Mortgage History
| Date | Status | Borrower | Loan Amount |
|---|---|---|---|
| Open | Macejko Andrew | $57,500 | |
| Previous Owner | Santor Michael A | $55,800 |
Source: Public Records
Tax History Compared to Growth
Tax History
| Year | Tax Paid | Tax Assessment Tax Assessment Total Assessment is a certain percentage of the fair market value that is determined by local assessors to be the total taxable value of land and additions on the property. | Land | Improvement |
|---|---|---|---|---|
| 2024 | $2,043 | $39,150 | $5,150 | $34,000 |
| 2023 | $2,016 | $39,150 | $5,150 | $34,000 |
| 2022 | $1,538 | $22,710 | $5,010 | $17,700 |
| 2021 | $1,539 | $22,710 | $5,010 | $17,700 |
| 2020 | $1,546 | $22,710 | $5,010 | $17,700 |
| 2019 | $1,432 | $18,460 | $4,070 | $14,390 |
| 2018 | $1,212 | $18,460 | $4,070 | $14,390 |
| 2017 | $1,289 | $18,460 | $4,070 | $14,390 |
| 2016 | $1,388 | $21,390 | $4,550 | $16,840 |
| 2015 | $1,361 | $21,390 | $4,550 | $16,840 |
| 2014 | $1,365 | $21,390 | $4,550 | $16,840 |
| 2013 | $1,348 | $21,390 | $4,550 | $16,840 |
Source: Public Records
Map
Nearby Homes
- 486 Annawan Ln
- 4552 New England Blvd
- 4622 Simon Rd
- 744 Nellbert Ln
- 4212 South Ave
- 4197 South Ave
- 429 Tudor Ln
- 4534 South Ave
- 186 Maple Dr
- 3930 Sunset Dr
- 0 Indianola Rd
- 204 Lowell Ave
- 241 Clarencedale Ave
- 0 Cranberry Ln Unit 5119702
- 365 E Midlothian Blvd
- 168 Lowell Ave
- 230 Clarencedale Ave
- 3726 Sunset Blvd
- 323 Melrose Ave
- 0 Mulberry Ln Unit 5119623