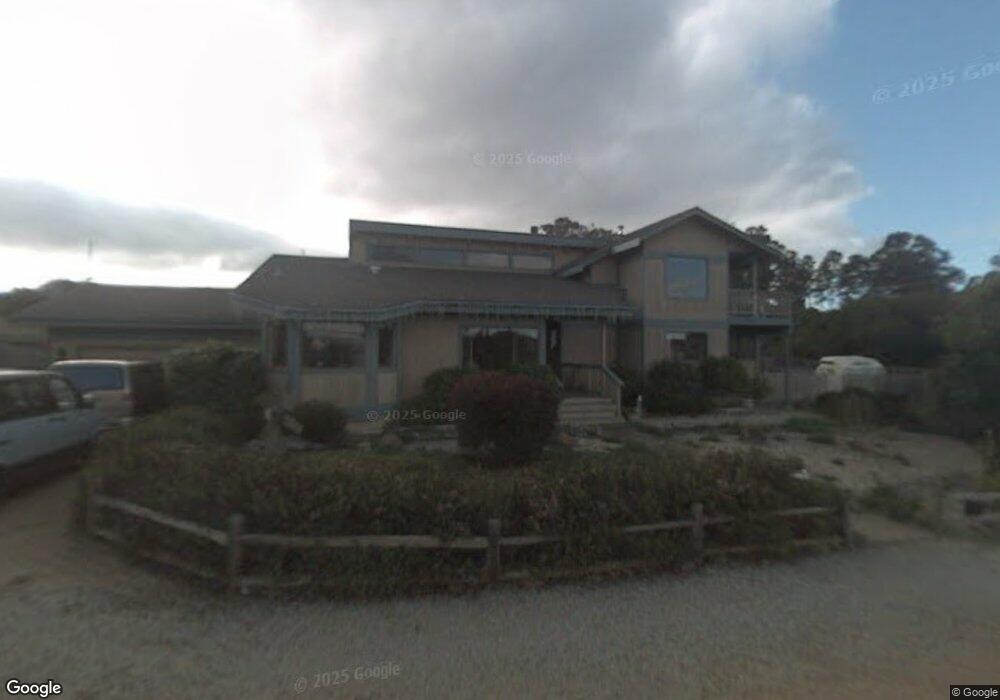
461 Skyline Dr Los Osos, CA 93402
Estimated Value: $1,155,000 - $1,504,000
4
Beds
3
Baths
2,295
Sq Ft
$587/Sq Ft
Est. Value
About This Home
This home is located at 461 Skyline Dr, Los Osos, CA 93402 and is currently estimated at $1,346,672, approximately $586 per square foot. 461 Skyline Dr is a home located in San Luis Obispo County with nearby schools including Monarch Grove Elementary School, Los Osos Middle School, and Morro Bay High School.
Ownership History
Date
Name
Owned For
Owner Type
Purchase Details
Closed on
Jul 15, 2022
Sold by
Anton Hubert
Bought by
Anton Hubert and Shi Kristina
Current Estimated Value
Purchase Details
Closed on
Aug 9, 2001
Sold by
Anton Hubert
Bought by
Anton Hubert and Anton Rita
Purchase Details
Closed on
Aug 3, 2001
Sold by
Vincent Donat A A and Vincent Martha A
Bought by
Anton Hubert
Purchase Details
Closed on
Jul 27, 2001
Sold by
Anton Rita
Bought by
Anton Hubert
Purchase Details
Closed on
Feb 10, 1998
Sold by
Vincent Donat and Vincent Martha
Bought by
Vincent Donat A and Vincent Martha A
Create a Home Valuation Report for This Property
The Home Valuation Report is an in-depth analysis detailing your home's value as well as a comparison with similar homes in the area
Home Values in the Area
Average Home Value in this Area
Purchase History
| Date | Buyer | Sale Price | Title Company |
|---|---|---|---|
| Anton Hubert | -- | None Listed On Document | |
| Anton Rita | -- | None Listed On Document | |
| Anton Hubert | -- | First American Title Ins Co | |
| Anton Hubert | $520,000 | First American Title Ins Co | |
| Anton Hubert | -- | First American Title Ins Co | |
| Vincent Donat A | -- | -- |
Source: Public Records
Tax History
| Year | Tax Paid | Tax Assessment Tax Assessment Total Assessment is a certain percentage of the fair market value that is determined by local assessors to be the total taxable value of land and additions on the property. | Land | Improvement |
|---|---|---|---|---|
| 2025 | $8,372 | $768,175 | $295,451 | $472,724 |
| 2024 | $8,372 | $753,113 | $289,658 | $463,455 |
| 2023 | $8,218 | $738,347 | $283,979 | $454,368 |
| 2022 | $7,704 | $723,870 | $278,411 | $445,459 |
| 2021 | $7,577 | $709,677 | $272,952 | $436,725 |
| 2020 | $7,498 | $702,401 | $270,154 | $432,247 |
| 2019 | $7,418 | $688,629 | $264,857 | $423,772 |
| 2018 | $7,270 | $675,127 | $259,664 | $415,463 |
| 2017 | $7,125 | $661,890 | $254,573 | $407,317 |
| 2016 | $6,984 | $648,913 | $249,582 | $399,331 |
| 2015 | $6,876 | $639,167 | $245,834 | $393,333 |
| 2014 | $6,319 | $626,648 | $241,019 | $385,629 |
Source: Public Records
Map
Nearby Homes
- 1840 Pine Ave
- 1830 Pine Ave
- 0 Ash St
- 2045 Pine Ave
- 305 Henrietta Ave
- 1871 Donna Ave
- 633 Ramona Ave Unit 26
- 0 Garden St
- 701 Los Osos Valley Rd
- 1705 5th St
- 319 Mar Vista Dr
- 749 Woodland Dr
- 306 Highland Dr
- 224 Butte Dr
- 781 Los Osos Valley Rd
- 2265 Del Norte St
- 246 Vista Ct
- 236 Marianela Ln
- 1701 8th St
- 2021 9th St
Your Personal Tour Guide
Ask me questions while you tour the home.