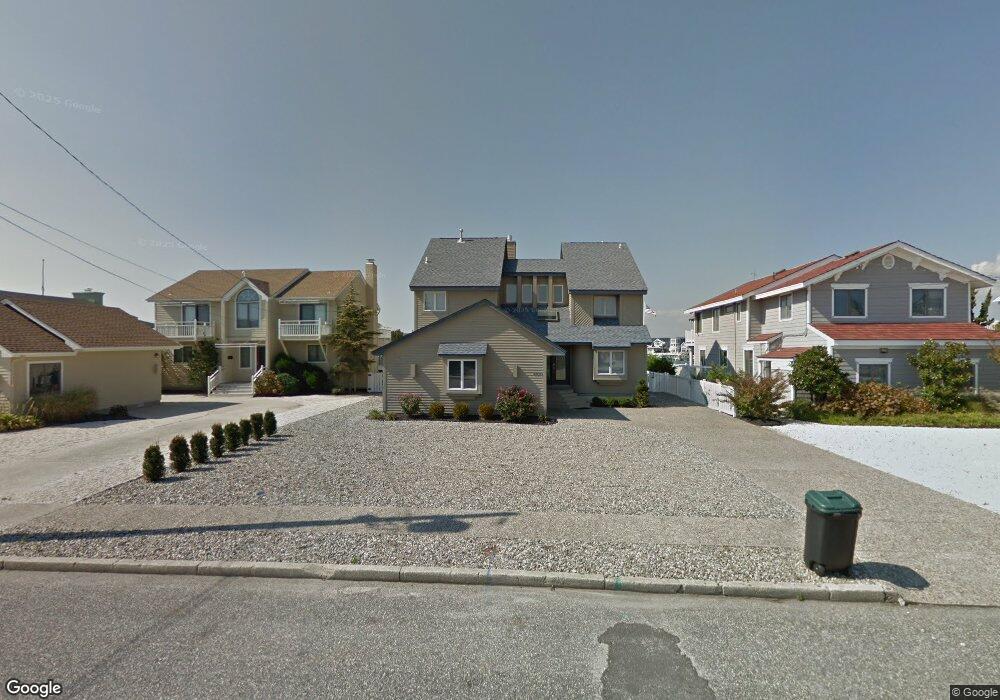
4610 5th Ave Avalon, NJ 08202
Estimated Value: $4,701,000 - $6,583,000
Studio
--
Bath
2,578
Sq Ft
$2,109/Sq Ft
Est. Value
About This Home
This home is located at 4610 5th Ave, Avalon, NJ 08202 and is currently estimated at $5,438,053, approximately $2,109 per square foot. 4610 5th Ave is a home located in Cape May County with nearby schools including Avalon Elementary School.
Ownership History
Date
Name
Owned For
Owner Type
Purchase Details
Closed on
Jun 14, 2023
Sold by
Mckernan Geoffrey
Bought by
Mckernan Geoffrey and Mckernan Nancy
Current Estimated Value
Purchase Details
Closed on
Mar 9, 2012
Sold by
Wrobleski Edward A and Wrobleski June P
Bought by
Mckernan Geoffery and Mckernan Nancy
Purchase Details
Closed on
Jul 31, 2008
Sold by
Wrobleski Edward A and Wrobleski June P
Bought by
Wrobleski Edward A and Wrobelski June P
Purchase Details
Closed on
Mar 25, 1991
Sold by
New Jersey Dep
Bought by
Wrobleski Edward A and Wrobleski June F
Create a Home Valuation Report for This Property
The Home Valuation Report is an in-depth analysis detailing your home's value as well as a comparison with similar homes in the area
Home Values in the Area
Average Home Value in this Area
Purchase History
| Date | Buyer | Sale Price | Title Company |
|---|---|---|---|
| Mckernan Geoffrey | -- | None Listed On Document | |
| Mckernan Geoffrey | -- | None Listed On Document | |
| Mckernan Geoffery | $2,500,000 | None Available | |
| Wrobleski Edward A | -- | None Available | |
| Wrobleski Edward A | $7,400 | -- |
Source: Public Records
Tax History
| Year | Tax Paid | Tax Assessment Tax Assessment Total Assessment is a certain percentage of the fair market value that is determined by local assessors to be the total taxable value of land and additions on the property. | Land | Improvement |
|---|---|---|---|---|
| 2025 | $17,602 | $2,866,800 | $2,400,000 | $466,800 |
| 2024 | $17,602 | $2,866,800 | $2,400,000 | $466,800 |
Source: Public Records
Map
Nearby Homes