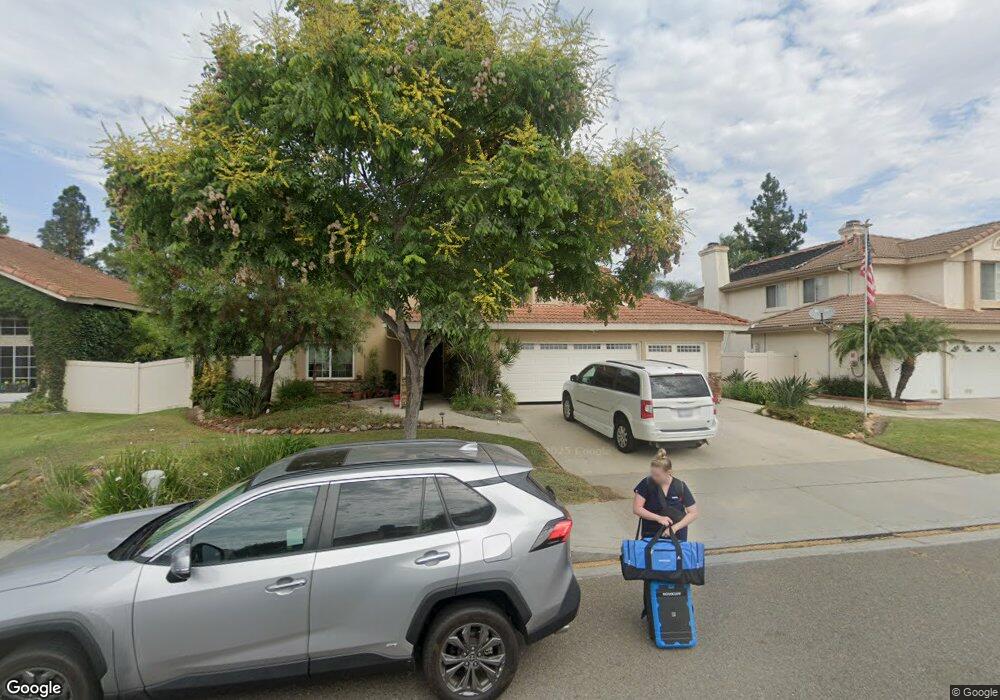
4610 Allende Ave Unit 1113 Oceanside, CA 92057
San Luis Rey NeighborhoodEstimated Value: $980,000 - $1,170,000
3
Beds
3
Baths
2,270
Sq Ft
$470/Sq Ft
Est. Value
About This Home
This home is located at 4610 Allende Ave Unit 1113, Oceanside, CA 92057 and is currently estimated at $1,067,285, approximately $470 per square foot. 4610 Allende Ave Unit 1113 is a home located in San Diego County with nearby schools including Nichols Elementary School, Cesar Chavez Middle School, and El Camino High School.
Ownership History
Date
Name
Owned For
Owner Type
Purchase Details
Closed on
Aug 1, 2008
Sold by
Dahlquist Fant Debra E
Bought by
Dahlquist Fant Debra E
Current Estimated Value
Purchase Details
Closed on
Jun 21, 2001
Sold by
Fant Thomas James
Bought by
Dahlquist Fant Debra E
Home Financials for this Owner
Home Financials are based on the most recent Mortgage that was taken out on this home.
Original Mortgage
$232,000
Outstanding Balance
$89,019
Interest Rate
7.24%
Estimated Equity
$978,266
Purchase Details
Closed on
Jun 6, 2001
Sold by
Ross Jeffrey A and Ross Barbara S
Bought by
Dahlquist Fant Debra E
Home Financials for this Owner
Home Financials are based on the most recent Mortgage that was taken out on this home.
Original Mortgage
$232,000
Outstanding Balance
$89,019
Interest Rate
7.24%
Estimated Equity
$978,266
Purchase Details
Closed on
Jul 6, 1990
Create a Home Valuation Report for This Property
The Home Valuation Report is an in-depth analysis detailing your home's value as well as a comparison with similar homes in the area
Home Values in the Area
Average Home Value in this Area
Purchase History
| Date | Buyer | Sale Price | Title Company |
|---|---|---|---|
| Dahlquist Fant Debra E | -- | None Available | |
| Dahlquist Fant Debra E | -- | Equity Title Company | |
| Dahlquist Fant Debra E | $290,000 | -- | |
| -- | $221,700 | -- |
Source: Public Records
Mortgage History
| Date | Status | Borrower | Loan Amount |
|---|---|---|---|
| Open | Dahlquist Fant Debra E | $232,000 |
Source: Public Records
Tax History Compared to Growth
Tax History
| Year | Tax Paid | Tax Assessment Tax Assessment Total Assessment is a certain percentage of the fair market value that is determined by local assessors to be the total taxable value of land and additions on the property. | Land | Improvement |
|---|---|---|---|---|
| 2025 | $4,669 | $428,391 | $134,330 | $294,061 |
| 2024 | $4,669 | $419,993 | $131,697 | $288,296 |
| 2023 | $4,524 | $411,759 | $129,115 | $282,644 |
| 2022 | $4,454 | $403,686 | $126,584 | $277,102 |
| 2021 | $4,470 | $395,771 | $124,102 | $271,669 |
| 2020 | $4,331 | $391,714 | $122,830 | $268,884 |
| 2019 | $4,205 | $384,034 | $120,422 | $263,612 |
| 2018 | $4,159 | $376,505 | $118,061 | $258,444 |
| 2017 | $4,081 | $369,124 | $115,747 | $253,377 |
| 2016 | $3,947 | $361,887 | $113,478 | $248,409 |
| 2015 | $3,832 | $356,452 | $111,774 | $244,678 |
| 2014 | -- | $349,471 | $109,585 | $239,886 |
Source: Public Records
Map
Nearby Homes
- 328 Liberty Way
- 4540 Arbor Glen Way
- 4398 Cadence Way
- 4468 White Pine Way
- 279 Hyacinth Way
- 4324 Manzanita Way
- 4733 Dalea Place
- 4314 Forest Ranch Rd
- 343 La Purisma Way
- 4235 Calle Del Vista
- 4310 Forest Ranch Way
- 4801 Siesta Place
- 231 Riverview Way
- 255 Flame Tree Place
- 99 Pheasant Ln Unit T
- 176 Flicker Ln
- 61 Hummingbird Ln
- 65 Hummingbird Ln
- 232 Manzanilla Way
- 305 Liberty Way
- 4612 Allende Ave Unit 1113
- 4608 Allende Ave
- 4614 Allende Ave
- 4606 Allende Ave
- 4607 Allende Ave
- 4616 Allende Ave
- 4609 Allende Ave
- 4605 Allende Ave Unit 1113
- 4604 Allende Ave
- 4611 Allende Ave
- 4603 Allende Ave
- 4613 Allende Ave
- 4620 Allende Ave
- 4602 Allende Ave
- 4601 Allende Ave
- 4619 Allende Ave
- 4612 Doral Ct
- 4608 Doral Ct
- 4616 Doral Ct
- 4624 Allende Ave