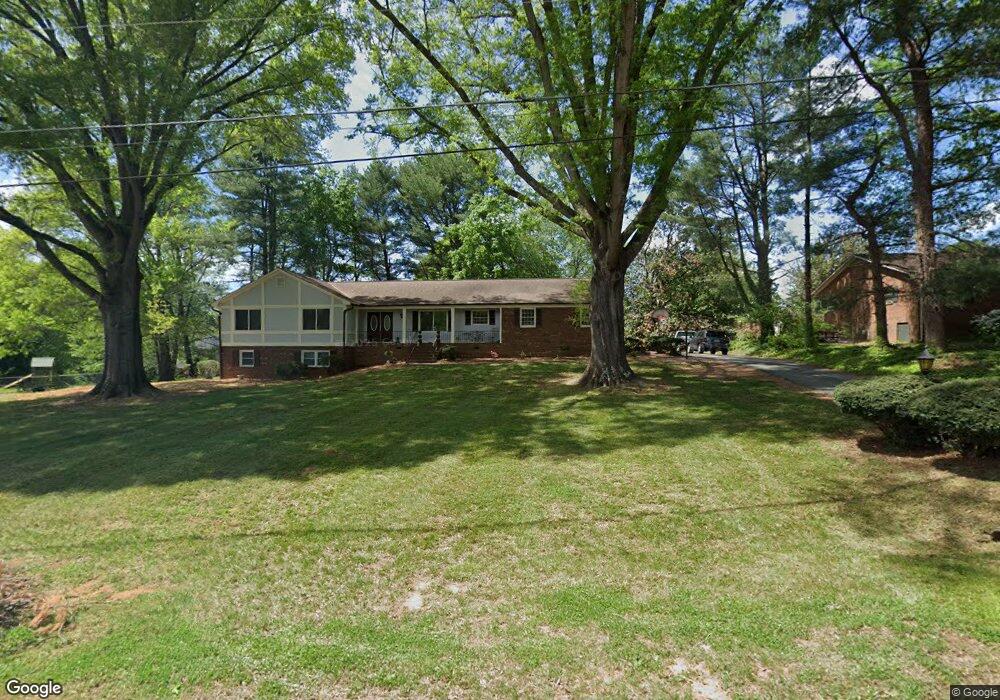
4610 Duffer Ct Pfafftown, NC 27040
Estimated Value: $329,000 - $403,000
4
Beds
3
Baths
1,904
Sq Ft
$193/Sq Ft
Est. Value
About This Home
This home is located at 4610 Duffer Ct, Pfafftown, NC 27040 and is currently estimated at $367,961, approximately $193 per square foot. 4610 Duffer Ct is a home located in Forsyth County with nearby schools including Old Richmond Elementary School, Northwest Middle, and Ronald W. Reagan High School.
Ownership History
Date
Name
Owned For
Owner Type
Purchase Details
Closed on
May 2, 2023
Sold by
Sprinkle Stefan
Bought by
Payne Nihya
Current Estimated Value
Purchase Details
Closed on
Oct 21, 2008
Sold by
Mack Mildred Sprinkle and Sprinkle Mildred
Bought by
Sprinkle Mildred
Home Financials for this Owner
Home Financials are based on the most recent Mortgage that was taken out on this home.
Original Mortgage
$50,000
Interest Rate
5.78%
Mortgage Type
Credit Line Revolving
Purchase Details
Closed on
Sep 9, 2008
Sold by
Burleigh Charles R and Burleigh Margaret A
Bought by
Mack Mildred Sprinkle
Home Financials for this Owner
Home Financials are based on the most recent Mortgage that was taken out on this home.
Original Mortgage
$50,000
Interest Rate
5.78%
Mortgage Type
Credit Line Revolving
Purchase Details
Closed on
Apr 8, 2004
Sold by
Burleigh Charles R and Burleigh Margaret A
Bought by
Burleigh Charles R and Burleigh Margaret A
Create a Home Valuation Report for This Property
The Home Valuation Report is an in-depth analysis detailing your home's value as well as a comparison with similar homes in the area
Purchase History
| Date | Buyer | Sale Price | Title Company |
|---|---|---|---|
| Payne Nihya | $50,000 | None Listed On Document | |
| Payne Nihya | $50,000 | None Listed On Document | |
| Sprinkle Mildred | -- | None Available | |
| Mack Mildred Sprinkle | $235,000 | None Available | |
| Burleigh Charles R | -- | -- |
Source: Public Records
Mortgage History
| Date | Status | Borrower | Loan Amount |
|---|---|---|---|
| Previous Owner | Sprinkle Mildred | $50,000 |
Source: Public Records
Tax History
| Year | Tax Paid | Tax Assessment Tax Assessment Total Assessment is a certain percentage of the fair market value that is determined by local assessors to be the total taxable value of land and additions on the property. | Land | Improvement |
|---|---|---|---|---|
| 2025 | $2,734 | $299,600 | $50,000 | $249,600 |
| 2024 | $1,790 | $194,900 | $42,000 | $152,900 |
| 2023 | $1,790 | $133,700 | $42,000 | $91,700 |
| 2022 | $1,757 | $133,700 | $42,000 | $91,700 |
| 2021 | $2,515 | $194,900 | $42,000 | $152,900 |
| 2020 | $2,517 | $182,300 | $36,000 | $146,300 |
| 2019 | $2,536 | $182,300 | $36,000 | $146,300 |
| 2018 | $2,408 | $182,300 | $36,000 | $146,300 |
| 2016 | $2,267 | $172,306 | $36,000 | $136,306 |
| 2015 | $2,233 | $172,306 | $36,000 | $136,306 |
| 2014 | $2,165 | $172,306 | $36,000 | $136,306 |
Source: Public Records
Map
Nearby Homes
- 4705 Duffer Ln
- 4229 Wedge Dr
- 3457 Grandview Crossing Ln
- 3439 Grandview Crossing Ln
- 4670 Fairway Run Dr
- 4381 Continental Dr
- 3665 Glennmoor Dr
- 4450 Rock Hill Rd
- 4671 Olivine Ln
- 4254 Lochurst Dr
- 4380 Wesmar Dr
- 5695 Reynolda Rd
- 4670 Wesmar Ct
- 3412 Lochurst Ct
- 3326 Grandview Club Rd
- 4444 Lochurst Dr
- 3525 Transou Rd
- 4434 Gracemont Dr NW
- 3493 Waterway Dr
- 4832 Old Towne Village Cir
Your Personal Tour Guide
Ask me questions while you tour the home.