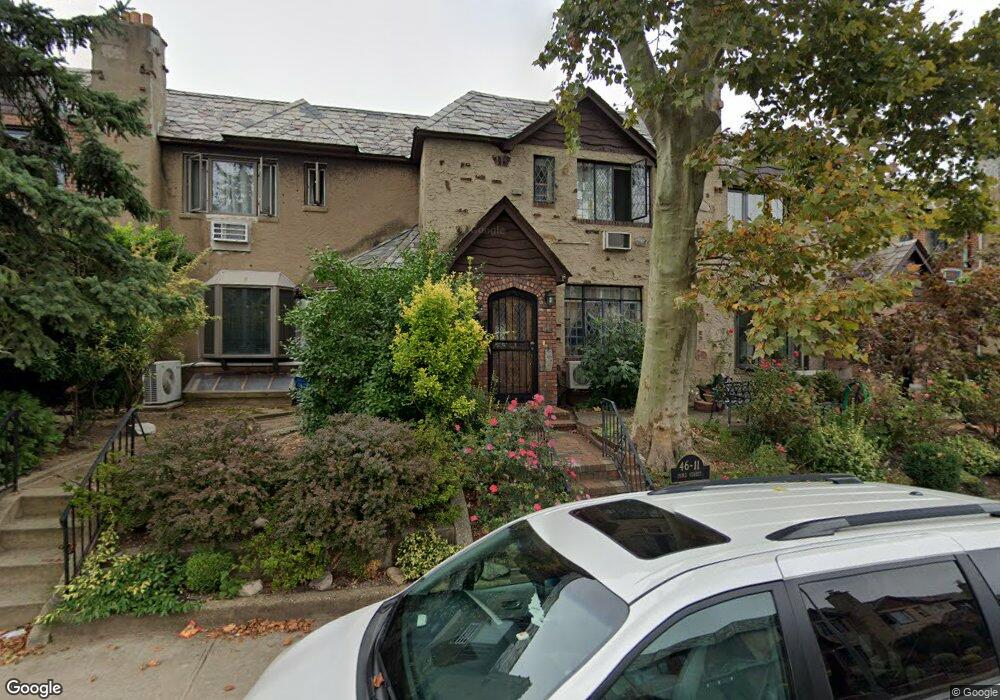
4611 193rd St Flushing, NY 11358
Auburndale NeighborhoodEstimated Value: $1,035,029 - $1,071,000
3
Beds
2
Baths
1,600
Sq Ft
$660/Sq Ft
Est. Value
About This Home
This home is located at 4611 193rd St, Flushing, NY 11358 and is currently estimated at $1,055,507, approximately $659 per square foot. 4611 193rd St is a home located in Queens County with nearby schools including P.S. 107 Thomas A Dooley, I.S. 25 Adrien Block, and Francis Lewis High School.
Ownership History
Date
Name
Owned For
Owner Type
Purchase Details
Closed on
Nov 29, 2023
Sold by
Cheng Eleanor and Cheng Yok Can
Bought by
Ec Family Trust and James Cheng Trustees
Current Estimated Value
Purchase Details
Closed on
Nov 21, 2013
Sold by
Campbell Edwin P and Campbell Nancy J
Bought by
Cheng Eleanor and Cheng Yok Can
Home Financials for this Owner
Home Financials are based on the most recent Mortgage that was taken out on this home.
Original Mortgage
$300,000
Interest Rate
4.14%
Mortgage Type
New Conventional
Create a Home Valuation Report for This Property
The Home Valuation Report is an in-depth analysis detailing your home's value as well as a comparison with similar homes in the area
Home Values in the Area
Average Home Value in this Area
Purchase History
| Date | Buyer | Sale Price | Title Company |
|---|---|---|---|
| Ec Family Trust | -- | -- | |
| Ec Family Trust | -- | -- | |
| Cheng Eleanor | $679,900 | -- | |
| Cheng Eleanor | $679,900 | -- |
Source: Public Records
Mortgage History
| Date | Status | Borrower | Loan Amount |
|---|---|---|---|
| Previous Owner | Cheng Eleanor | $300,000 |
Source: Public Records
Tax History
| Year | Tax Paid | Tax Assessment Tax Assessment Total Assessment is a certain percentage of the fair market value that is determined by local assessors to be the total taxable value of land and additions on the property. | Land | Improvement |
|---|---|---|---|---|
| 2025 | $9,026 | $47,278 | $13,337 | $33,941 |
| 2024 | $9,026 | $44,940 | $12,962 | $31,978 |
| 2023 | $8,516 | $42,398 | $11,818 | $30,580 |
| 2022 | $8,449 | $53,580 | $15,420 | $38,160 |
| 2021 | $7,876 | $56,160 | $15,420 | $40,740 |
| 2020 | $8,339 | $53,520 | $15,420 | $38,100 |
| 2019 | $7,834 | $53,820 | $15,420 | $38,400 |
| 2018 | $7,202 | $35,332 | $9,701 | $25,631 |
| 2017 | $7,067 | $34,669 | $11,848 | $22,821 |
| 2016 | $6,635 | $34,669 | $11,848 | $22,821 |
| 2015 | $3,725 | $32,832 | $14,336 | $18,496 |
| 2014 | $3,725 | $31,209 | $15,577 | $15,632 |
Source: Public Records
Map
Nearby Homes
- 4604 195th St
- 45-47 193rd St
- 4539 192nd St
- 4552 196th St
- 45-31 195th St
- 47-55 194th St
- 4719 192nd St
- 47-49 194th St
- 45-66 196th Place
- 47-18 190th St
- 4756 196th St
- 43-44 195th St
- 19005 48th Ave
- 43-28 196th St
- 45-32 Utopia Pkwy
- 196-64 45th Ave
- 4818 190th St
- 199-04 47th Ave
- 47-02 Francis Lewis Blvd
- 171-06 Bagley Ave
Your Personal Tour Guide
Ask me questions while you tour the home.