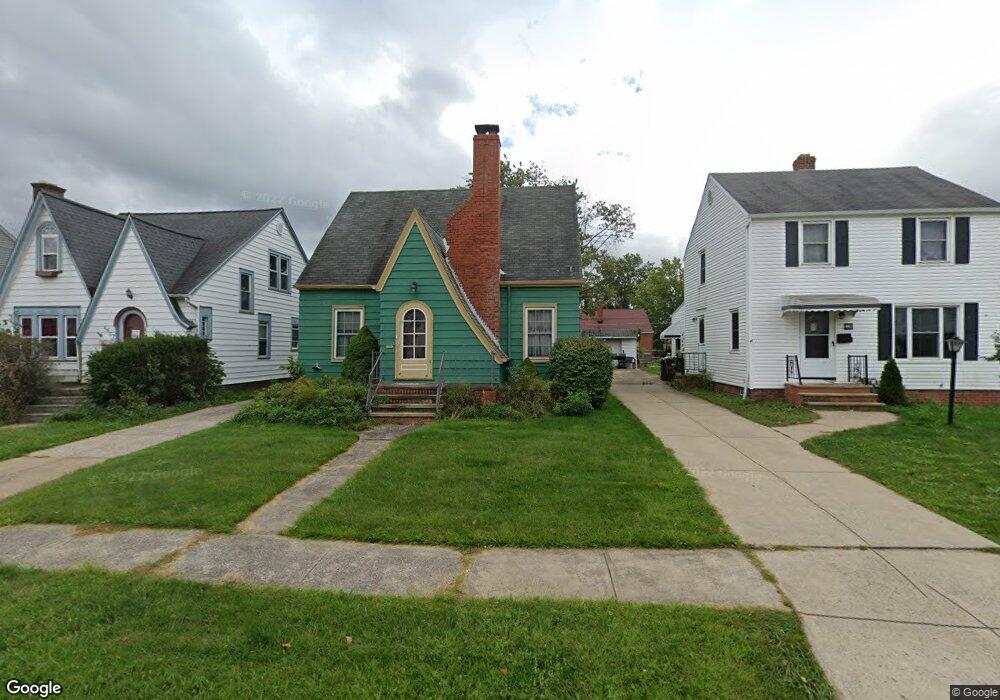
4611 Albertly Ave Cleveland, OH 44134
Estimated Value: $183,000 - $215,000
3
Beds
2
Baths
1,231
Sq Ft
$161/Sq Ft
Est. Value
About This Home
This home is located at 4611 Albertly Ave, Cleveland, OH 44134 and is currently estimated at $197,771, approximately $160 per square foot. 4611 Albertly Ave is a home located in Cuyahoga County with nearby schools including Shiloh Middle School, Parma High School, and St Charles School.
Ownership History
Date
Name
Owned For
Owner Type
Purchase Details
Closed on
Aug 24, 2011
Sold by
Rickard Herbert Joel
Bought by
Munis Erica S
Current Estimated Value
Home Financials for this Owner
Home Financials are based on the most recent Mortgage that was taken out on this home.
Original Mortgage
$69,800
Outstanding Balance
$48,284
Interest Rate
4.55%
Mortgage Type
Purchase Money Mortgage
Estimated Equity
$149,487
Purchase Details
Closed on
Oct 23, 2009
Sold by
Augustine Robert F
Bought by
Munis Erica S and Rickard Herbert Joel
Home Financials for this Owner
Home Financials are based on the most recent Mortgage that was taken out on this home.
Original Mortgage
$70,400
Interest Rate
5.1%
Mortgage Type
Purchase Money Mortgage
Purchase Details
Closed on
Nov 15, 1979
Sold by
Augustine Verna M and Augustine Frank A
Bought by
Augustine Verna M
Purchase Details
Closed on
Jan 1, 1975
Bought by
Augustine Verna M and Augustine Frank A
Create a Home Valuation Report for This Property
The Home Valuation Report is an in-depth analysis detailing your home's value as well as a comparison with similar homes in the area
Home Values in the Area
Average Home Value in this Area
Purchase History
| Date | Buyer | Sale Price | Title Company |
|---|---|---|---|
| Munis Erica S | $47,500 | Patriot | |
| Munis Erica S | $88,000 | Maximum Title | |
| Augustine Verna M | -- | -- | |
| Augustine Verna M | -- | -- |
Source: Public Records
Mortgage History
| Date | Status | Borrower | Loan Amount |
|---|---|---|---|
| Open | Munis Erica S | $69,800 | |
| Previous Owner | Munis Erica S | $70,400 |
Source: Public Records
Tax History Compared to Growth
Tax History
| Year | Tax Paid | Tax Assessment Tax Assessment Total Assessment is a certain percentage of the fair market value that is determined by local assessors to be the total taxable value of land and additions on the property. | Land | Improvement |
|---|---|---|---|---|
| 2024 | $3,133 | $50,855 | $10,080 | $40,775 |
| 2023 | $2,796 | $38,960 | $8,020 | $30,940 |
| 2022 | $2,769 | $38,960 | $8,020 | $30,940 |
| 2021 | $2,847 | $38,960 | $8,020 | $30,940 |
| 2020 | $2,495 | $29,960 | $6,160 | $23,800 |
| 2019 | $2,386 | $85,600 | $17,600 | $68,000 |
| 2018 | $2,400 | $29,960 | $6,160 | $23,800 |
| 2017 | $2,253 | $26,150 | $4,830 | $21,320 |
| 2016 | $2,241 | $26,150 | $4,830 | $21,320 |
| 2015 | $2,235 | $26,150 | $4,830 | $21,320 |
| 2014 | $2,235 | $28,110 | $5,180 | $22,930 |
Source: Public Records
Map
Nearby Homes
- 4424 Forestwood Dr
- 4710 Maplecrest Ave
- 4202 Sheraton Dr
- 4002 Maplecrest Ave
- 4206 Liggett Dr
- 4802 Grantwood Dr
- 3436 Heresford Dr
- 4507 Grantwood Dr
- 5603 Allanwood Dr
- 3408 Parklane Dr
- 4302 Woodrow Ave
- 5815 Wilber Ave
- 5205 Woodrow Ave
- 6189 W 54th St
- 3910 Wood Ave
- 5415 Pelham Dr
- 6021 Snow Rd
- 4005 Pershing Ave
- 3710 Wood Ave
- 5212 Wood Ave
- 4615 Albertly Ave
- 4607 Albertly Ave
- 4619 Albertly Ave
- 4603 Albertly Ave
- 4531 Albertly Ave
- 4610 Dawnshire Dr
- 4614 Dawnshire Dr
- 4606 Dawnshire Dr
- 4709 Albertly Ave
- 4618 Dawnshire Dr
- 4602 Dawnshire Dr
- 4527 Albertly Ave
- 4702 Dawnshire Dr
- 4610 Albertly Ave
- 4530 Dawnshire Dr
- 4614 Albertly Ave
- 4606 Albertly Ave
- 4602 Albertly Ave
- 4618 Albertly Ave
- 4711 Albertly Ave