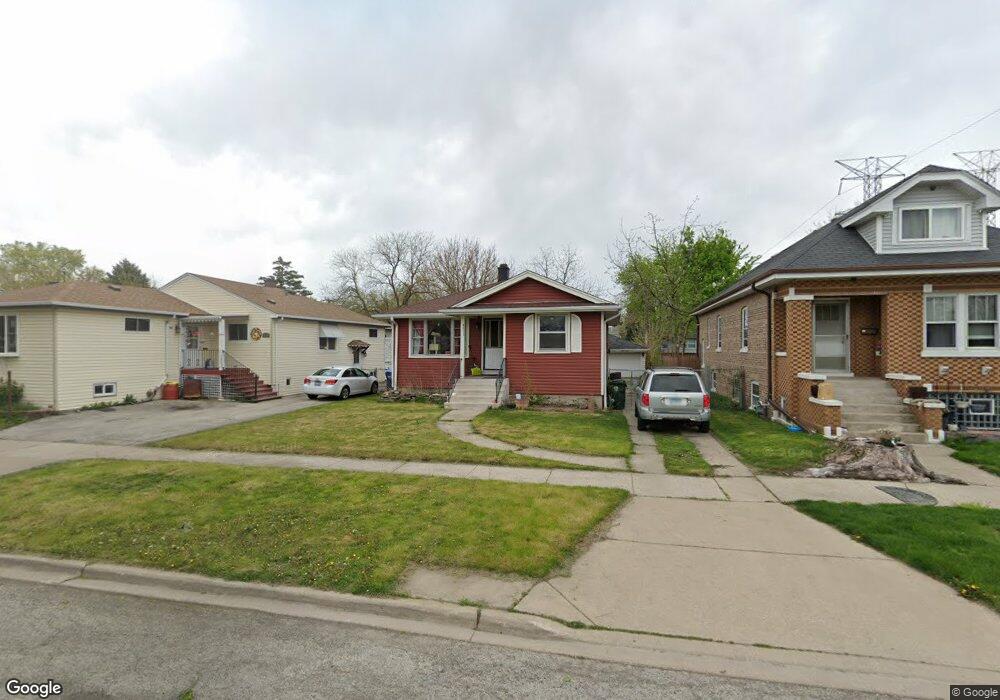
4611 Clinton Ave Berwyn, IL 60402
Estimated Value: $205,000 - $285,022
2
Beds
1
Bath
946
Sq Ft
$271/Sq Ft
Est. Value
About This Home
This home is located at 4611 Clinton Ave, Berwyn, IL 60402 and is currently estimated at $256,756, approximately $271 per square foot. 4611 Clinton Ave is a home located in Cook County with nearby schools including Home Elementary School, George Washington Middle School, and J. Sterling Morton High School West.
Ownership History
Date
Name
Owned For
Owner Type
Purchase Details
Closed on
Feb 13, 2012
Sold by
Beikzadeh Ramezan
Bought by
Villa Margarita
Current Estimated Value
Purchase Details
Closed on
Sep 30, 2002
Sold by
Court Roger
Bought by
Biekzadeh Ramezen
Home Financials for this Owner
Home Financials are based on the most recent Mortgage that was taken out on this home.
Original Mortgage
$96,000
Interest Rate
6.24%
Purchase Details
Closed on
Jun 6, 1997
Sold by
Sackley Janice J and Drechen Martin J
Bought by
Court Roger A
Home Financials for this Owner
Home Financials are based on the most recent Mortgage that was taken out on this home.
Original Mortgage
$92,000
Interest Rate
8%
Create a Home Valuation Report for This Property
The Home Valuation Report is an in-depth analysis detailing your home's value as well as a comparison with similar homes in the area
Home Values in the Area
Average Home Value in this Area
Purchase History
| Date | Buyer | Sale Price | Title Company |
|---|---|---|---|
| Villa Margarita | -- | None Available | |
| Biekzadeh Ramezen | $120,000 | Prairie Title | |
| Court Roger A | $115,000 | -- |
Source: Public Records
Mortgage History
| Date | Status | Borrower | Loan Amount |
|---|---|---|---|
| Previous Owner | Biekzadeh Ramezen | $96,000 | |
| Previous Owner | Court Roger A | $92,000 |
Source: Public Records
Tax History Compared to Growth
Tax History
| Year | Tax Paid | Tax Assessment Tax Assessment Total Assessment is a certain percentage of the fair market value that is determined by local assessors to be the total taxable value of land and additions on the property. | Land | Improvement |
|---|---|---|---|---|
| 2024 | $5,570 | $20,000 | $5,918 | $14,082 |
| 2023 | $4,804 | $20,000 | $5,918 | $14,082 |
| 2022 | $4,804 | $15,853 | $5,096 | $10,757 |
| 2021 | $4,987 | $15,852 | $5,096 | $10,756 |
| 2020 | $5,557 | $17,254 | $5,096 | $12,158 |
| 2019 | $4,298 | $13,117 | $4,603 | $8,514 |
| 2018 | $4,180 | $13,117 | $4,603 | $8,514 |
| 2017 | $4,041 | $13,117 | $4,603 | $8,514 |
| 2016 | $3,325 | $10,119 | $3,781 | $6,338 |
| 2015 | $3,288 | $10,119 | $3,781 | $6,338 |
| 2014 | $3,121 | $10,119 | $3,781 | $6,338 |
| 2013 | $4,622 | $14,115 | $3,781 | $10,334 |
Source: Public Records
Map
Nearby Homes
- 4515 Clinton Ave
- 4510 Kenilworth Ave
- 4536 Oak Park Ave
- 4445 Grove Ave
- 4405 Grove Ave
- 4337 Home Ave
- 6910 43rd St
- 4239 Grove Ave
- 4218 Home Ave
- 4136 Home Ave
- 4215 Harlem Ave Unit 8
- 4122 Clinton Ave
- 4122 Wenonah Ave
- 4109 Wenonah Ave
- 5148 S Newland Ave
- 5137 S Rutherford Ave
- 5154 S Nordica Ave
- 4115 S Harlem Ave Unit GE
- 4031 Clinton Ave
- 6718 41st St
- 4609 Clinton Ave
- 4615 Clinton Ave
- 4607 Clinton Ave
- 4617 Clinton Ave
- 4618 Kenilworth Ave
- 4616 Kenilworth Ave
- 4605 Clinton Ave
- 4622 Kenilworth Ave
- 4614 Kenilworth Ave
- 4820 Clinton Ave
- 4612 Kenilworth Ave
- 4603 Clinton Ave
- 4610 Kenilworth Ave
- 4608 Kenilworth Ave
- 4601 Clinton Ave
- 4600 Kenilworth Ave
- 4617 Kenilworth Ave
- 4615 Kenilworth Ave
- 4621 Kenilworth Ave
- 4613 Kenilworth Ave