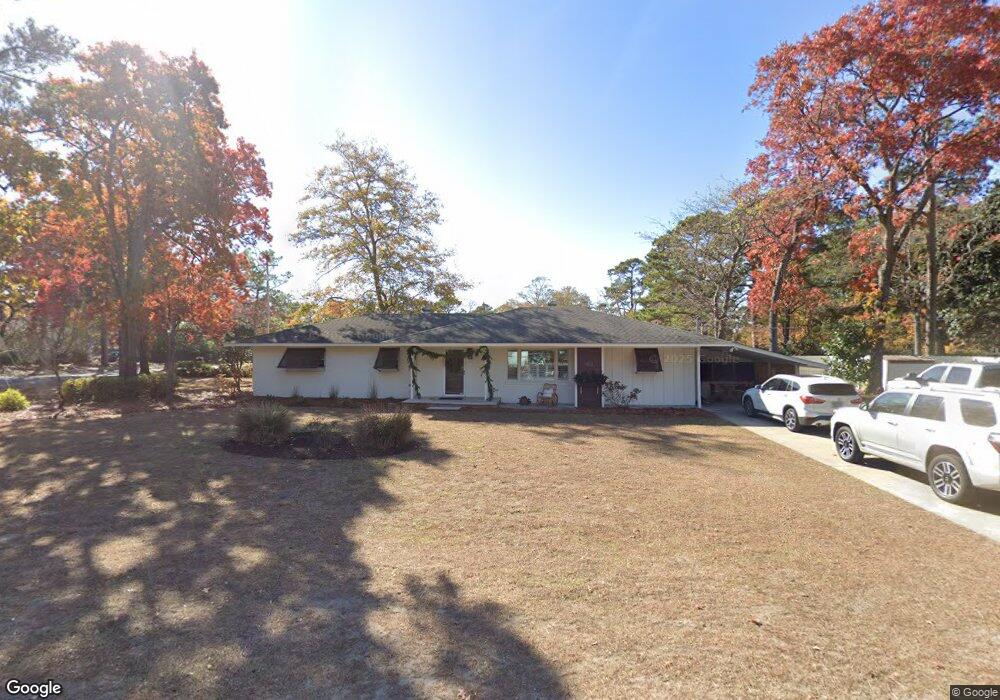
4611 Little River Rd Unit 4611 Little River Rd Myrtle Beach, SC 29577
Downtown Myrtle Beach NeighborhoodEstimated Value: $367,000 - $428,000
3
Beds
2
Baths
2,108
Sq Ft
$194/Sq Ft
Est. Value
About This Home
This home is located at 4611 Little River Rd Unit 4611 Little River Rd, Myrtle Beach, SC 29577 and is currently estimated at $408,495, approximately $193 per square foot. 4611 Little River Rd Unit 4611 Little River Rd is a home located in Horry County with nearby schools including Myrtle Beach Child Development Center, Myrtle Beach Elementary School, and Myrtle Beach Primary School.
Ownership History
Date
Name
Owned For
Owner Type
Purchase Details
Closed on
Aug 23, 2022
Sold by
Robertson Steven Lloyd
Bought by
Thomasson Eric C
Current Estimated Value
Home Financials for this Owner
Home Financials are based on the most recent Mortgage that was taken out on this home.
Original Mortgage
$300,000
Outstanding Balance
$286,516
Interest Rate
5.38%
Mortgage Type
New Conventional
Estimated Equity
$121,979
Purchase Details
Closed on
Jan 10, 2020
Sold by
Wurst Marie Janet Le
Bought by
Robertson Steven L and Robertson Lisa D
Home Financials for this Owner
Home Financials are based on the most recent Mortgage that was taken out on this home.
Original Mortgage
$100,000
Interest Rate
3.73%
Mortgage Type
New Conventional
Create a Home Valuation Report for This Property
The Home Valuation Report is an in-depth analysis detailing your home's value as well as a comparison with similar homes in the area
Home Values in the Area
Average Home Value in this Area
Purchase History
| Date | Buyer | Sale Price | Title Company |
|---|---|---|---|
| Thomasson Eric C | $407,450 | -- | |
| Robertson Steven L | $180,000 | -- |
Source: Public Records
Mortgage History
| Date | Status | Borrower | Loan Amount |
|---|---|---|---|
| Open | Thomasson Eric C | $300,000 | |
| Previous Owner | Robertson Steven L | $100,000 |
Source: Public Records
Tax History Compared to Growth
Tax History
| Year | Tax Paid | Tax Assessment Tax Assessment Total Assessment is a certain percentage of the fair market value that is determined by local assessors to be the total taxable value of land and additions on the property. | Land | Improvement |
|---|---|---|---|---|
| 2024 | $6,337 | $24,888 | $10,975 | $13,913 |
| 2023 | $6,337 | $7,890 | $5,510 | $2,380 |
| 2021 | $727 | $7,890 | $5,510 | $2,380 |
| 2020 | $2,992 | $8,126 | $5,510 | $2,616 |
| 2019 | $2,992 | $12,190 | $8,266 | $3,924 |
| 2018 | $372 | $6,731 | $3,871 | $2,860 |
| 2017 | $361 | $6,731 | $3,871 | $2,860 |
| 2016 | -- | $6,731 | $3,871 | $2,860 |
| 2015 | $358 | $6,732 | $3,872 | $2,860 |
| 2014 | $322 | $6,732 | $3,872 | $2,860 |
Source: Public Records
Map
Nearby Homes
- 809 48th Ave N Unit MB
- 4800 Camellia Dr
- 900 Courtyard Dr Unit N5
- 900 Courtyard Dr Unit K7
- 4703 Bermuda Way
- 5001 Little River Rd Unit W-214
- 5001 Little River Rd Unit W-110
- 5001 Little River Rd Unit E-102
- 5001 Little River Rd Unit E-504
- 5001 Little River Rd Unit E-502
- 5001 Little River Rd Unit E110
- 5001 Little River Rd Unit E-514
- 5001 Little River Rd Unit W-106
- 5001 Little River Rd Unit E-312
- 5001 Little River Rd Unit E108
- 5001 Little River Rd Unit E-411
- 5001 Little River Rd Unit W-504
- 5001 Little River Rd Unit E-208
- 5001 Little River Rd Unit E-107
- 5001 Little River Rd Unit W-501
- 4611 Little River Rd
- 4611 Little River Rd Unit Corner of Little Riv
- 4609 Little River Rd
- 801 47th Ave N
- 801 47th Ave N Unit Pine Lakes
- 4701 Little River Rd
- 4607 Little River Rd
- 4801 Little River Rd
- 803 47th Ave N
- 712 47th Ave N
- 800 47th Ave N
- 4605 Little River Rd
- 802 47th Ave N
- 713 47th Ave N
- 805 47th Ave N
- 710 47th Ave N
- 4603 Little River Rd
- 713 48th Ave N
- 711 47th Ave N
- 807 47th Ave N