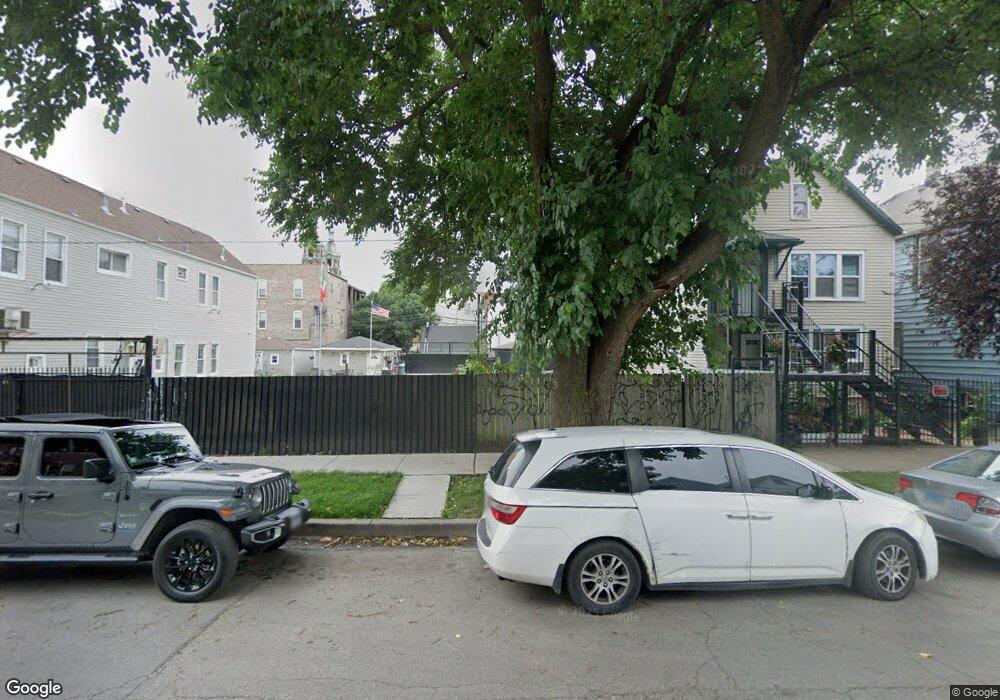
4611 S Honore St Unit 2 Chicago, IL 60609
McKinley Park NeighborhoodEstimated Value: $200,000 - $227,994
4
Beds
2
Baths
1,440
Sq Ft
$149/Sq Ft
Est. Value
About This Home
This home is located at 4611 S Honore St Unit 2, Chicago, IL 60609 and is currently estimated at $213,997, approximately $148 per square foot. 4611 S Honore St Unit 2 is a home located in Cook County with nearby schools including Lara Elementary Academy.
Ownership History
Date
Name
Owned For
Owner Type
Purchase Details
Closed on
Mar 12, 2004
Sold by
Avila Juan
Bought by
Ramirez Juan
Current Estimated Value
Home Financials for this Owner
Home Financials are based on the most recent Mortgage that was taken out on this home.
Original Mortgage
$149,380
Outstanding Balance
$68,106
Interest Rate
5.65%
Mortgage Type
Commercial
Estimated Equity
$145,891
Purchase Details
Closed on
Apr 2, 1998
Sold by
Alanis Avila Juan M and Alanis Avila Arturo
Bought by
Avila Juan M
Home Financials for this Owner
Home Financials are based on the most recent Mortgage that was taken out on this home.
Original Mortgage
$68,000
Interest Rate
7.27%
Mortgage Type
Commercial
Purchase Details
Closed on
Jun 13, 1996
Sold by
Wheeler Roxie
Bought by
Alanis Avila Juan M and Alanis Avila Arturo
Home Financials for this Owner
Home Financials are based on the most recent Mortgage that was taken out on this home.
Original Mortgage
$63,701
Interest Rate
8.07%
Mortgage Type
FHA
Create a Home Valuation Report for This Property
The Home Valuation Report is an in-depth analysis detailing your home's value as well as a comparison with similar homes in the area
Home Values in the Area
Average Home Value in this Area
Purchase History
| Date | Buyer | Sale Price | Title Company |
|---|---|---|---|
| Ramirez Juan | $154,000 | Residential Title Services | |
| Avila Juan M | -- | -- | |
| Alanis Avila Juan M | $64,000 | Attorneys Natl Title Network |
Source: Public Records
Mortgage History
| Date | Status | Borrower | Loan Amount |
|---|---|---|---|
| Open | Ramirez Juan | $149,380 | |
| Previous Owner | Avila Juan M | $68,000 | |
| Previous Owner | Alanis Avila Juan M | $63,701 |
Source: Public Records
Tax History
| Year | Tax Paid | Tax Assessment Tax Assessment Total Assessment is a certain percentage of the fair market value that is determined by local assessors to be the total taxable value of land and additions on the property. | Land | Improvement |
|---|---|---|---|---|
| 2025 | $584 | $2,250 | $1,786 | $464 |
| 2024 | $584 | $2,250 | $1,786 | $464 |
| 2023 | $570 | $2,756 | $2,381 | $375 |
| 2022 | $570 | $2,756 | $2,381 | $375 |
| 2021 | $554 | $2,755 | $2,380 | $375 |
| 2020 | $751 | $3,351 | $2,976 | $375 |
| 2019 | $678 | $3,351 | $2,976 | $375 |
| 2018 | $592 | $2,976 | $2,976 | $0 |
| 2017 | $602 | $2,778 | $2,678 | $100 |
| 2016 | $1,858 | $11,711 | $2,678 | $9,033 |
| 2015 | $1,677 | $11,711 | $2,678 | $9,033 |
| 2014 | $1,471 | $10,435 | $2,529 | $7,906 |
| 2013 | $1,431 | $10,435 | $2,529 | $7,906 |
Source: Public Records
Map
Nearby Homes
- 4535 S Honore St
- 4534 S Honore St
- 4521 S Hermitage Ave
- 4530 S Paulina St
- 4446 S Wood St
- 4739 S Hermitage Ave
- 1756 W 48th St
- 4712 S Marshfield Ave
- 1700 W 48th St
- 4329 S Wood St
- 4849 S Paulina St
- 1620 W 44th St
- 4822 S Seeley Ave
- 4505 S Justine St
- 4629 S Laflin St
- 4858 S Justine St
- 4817 S Laflin St
- 4937 S Hoyne Ave
- 5014 S Paulina St
- 4838 S Bishop St
- 4609 S Honore St
- 4613 S Honore St
- 4607 S Honore St
- 4615 S Honore St
- 4603 S Honore St
- 4617 S Honore St
- 4621 S Honore St
- 4601 S Honore St
- 4623 S Honore St Unit 1FRT
- 4614 S Honore St
- 4612 S Honore St
- 4612 S Honore St
- 4610 S Honore St
- 4608 S Honore St
- 4610 S Wood St Unit 2
- 4610 S Wood St Unit 1R
- 4610 S Wood St Unit 1F
- 4608 S Wood St
- 4612 S Wood St
- 4629 S Honore St
Your Personal Tour Guide
Ask me questions while you tour the home.