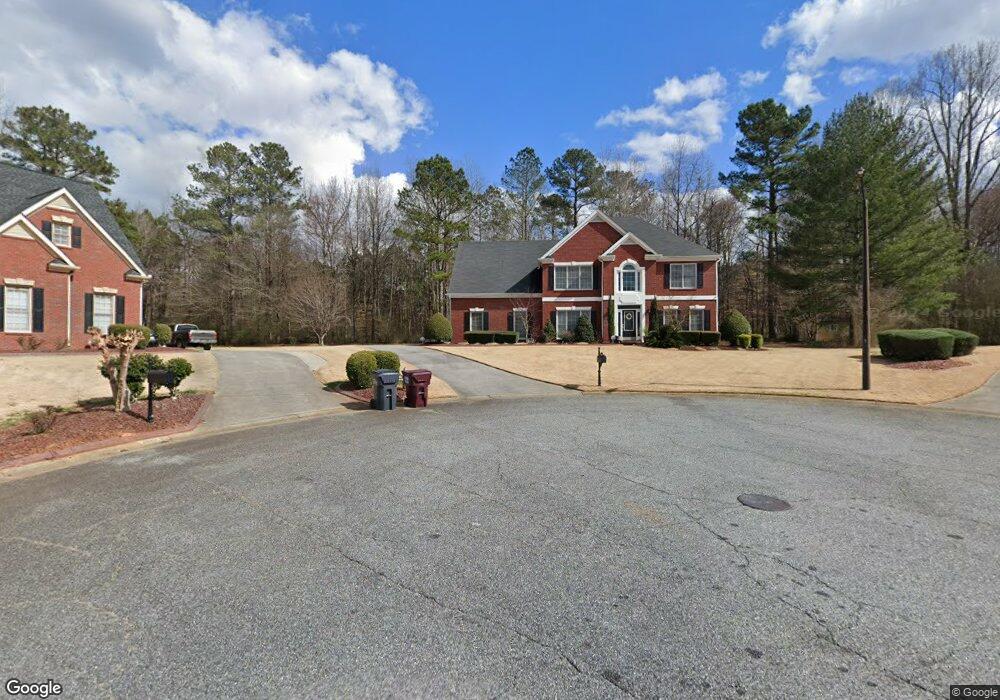
4611 Springside Ct SW Unit II Mableton, GA 30126
Estimated Value: $447,908 - $549,000
4
Beds
3
Baths
2,901
Sq Ft
$175/Sq Ft
Est. Value
About This Home
This home is located at 4611 Springside Ct SW Unit II, Mableton, GA 30126 and is currently estimated at $506,227, approximately $174 per square foot. 4611 Springside Ct SW Unit II is a home located in Cobb County with nearby schools including Deerwood Elementary School, Sunrise Elementary School, and Sanders Elementary School.
Ownership History
Date
Name
Owned For
Owner Type
Purchase Details
Closed on
May 14, 2021
Sold by
Derozario Doreen
Bought by
Webster Lloyd
Current Estimated Value
Purchase Details
Closed on
Dec 11, 2015
Sold by
Webster Lloyd
Bought by
Webster Lloyd and Derozario Doreen
Purchase Details
Closed on
Oct 27, 2011
Sold by
Harrow Thaddeus
Bought by
Webster Lloyd A
Home Financials for this Owner
Home Financials are based on the most recent Mortgage that was taken out on this home.
Original Mortgage
$136,000
Interest Rate
3.25%
Mortgage Type
New Conventional
Purchase Details
Closed on
Jul 16, 1998
Sold by
Live Oak Bldrs
Bought by
Harrow Thaddeus and Harrow Berneita
Home Financials for this Owner
Home Financials are based on the most recent Mortgage that was taken out on this home.
Original Mortgage
$180,000
Interest Rate
6.99%
Mortgage Type
New Conventional
Create a Home Valuation Report for This Property
The Home Valuation Report is an in-depth analysis detailing your home's value as well as a comparison with similar homes in the area
Home Values in the Area
Average Home Value in this Area
Purchase History
| Date | Buyer | Sale Price | Title Company |
|---|---|---|---|
| Webster Lloyd | -- | None Available | |
| Webster Lloyd | -- | -- | |
| Webster Lloyd A | $170,000 | -- | |
| Harrow Thaddeus | $240,000 | -- |
Source: Public Records
Mortgage History
| Date | Status | Borrower | Loan Amount |
|---|---|---|---|
| Previous Owner | Webster Lloyd A | $136,000 | |
| Previous Owner | Harrow Thaddeus | $180,000 |
Source: Public Records
Tax History Compared to Growth
Tax History
| Year | Tax Paid | Tax Assessment Tax Assessment Total Assessment is a certain percentage of the fair market value that is determined by local assessors to be the total taxable value of land and additions on the property. | Land | Improvement |
|---|---|---|---|---|
| 2025 | $5,528 | $232,728 | $52,000 | $180,728 |
| 2024 | $5,533 | $232,728 | $52,000 | $180,728 |
| 2023 | $3,580 | $167,732 | $34,000 | $133,732 |
| 2022 | $4,154 | $167,732 | $34,000 | $133,732 |
| 2021 | $3,357 | $131,280 | $30,000 | $101,280 |
| 2020 | $3,357 | $131,280 | $30,000 | $101,280 |
| 2019 | $2,896 | $110,244 | $30,000 | $80,244 |
| 2018 | $2,896 | $110,244 | $30,000 | $80,244 |
| 2017 | $2,557 | $100,456 | $24,000 | $76,456 |
| 2016 | $2,559 | $100,456 | $24,000 | $76,456 |
| 2015 | $2,403 | $90,716 | $22,000 | $68,716 |
| 2014 | $2,423 | $90,716 | $0 | $0 |
Source: Public Records
Map
Nearby Homes
- 4612 Springside Ct SW
- Linden Plan at Sweetlake Grove - Bungalow Series
- 4690 Glore Rd SW
- 4556 Sweetlake Rd SW
- 8009 Haven Springs Trace
- 8029 Haven Springs Trace
- 8025 Haven Springs Trace
- 8041 Haven Springs Trace
- 1078 Hibiscus Way SW
- 4630 Brookwood Dr SW
- 1240 Parktown Dr Unit 4
- 960 Verlander Trail
- 971 Verlander Trail
- 1021 Wisteria Dr SW
- 4406 Yelverton Place
- 1146 Silvergate Ln
- Kaufman Plan at Wilkins Walk
- Bryson Plan at Wilkins Walk
- Brooks Plan at Wilkins Walk
- 4569 Moray Dr
- 4610 Springside Ct SW Unit 2
- 4613 Springside Ct SW
- 1250 Heritage Lakes Dr SW Unit 2
- 4678 Glore Rd SW Unit 37234569
- 4678 Glore Rd SW Unit 37234556
- 4678 Glore Rd SW Unit 37234493
- 4678 Glore Rd SW Unit 37234191
- 4678 Glore Rd SW Unit 37168493
- 4678 Glore Rd SW Unit 37168182
- 4678 Glore Rd SW Unit 37167493
- 4678 Glore Rd SW Unit 37164741
- 4678 Glore Rd SW Unit 37164705
- 4678 Glore Rd SW
- 1248 Heritage Lakes Dr SW Unit 14
- 1248 Heritage Lakes Dr SW
- 1258 Heritage Lakes Dr SW Unit 1
- 1249 Heritage Lakes Dr SW Unit 2
- 1244 Heritage Lakes Dr SW
- 4560 Glore Crossing Dr SW
- 4562 Glore Crossing Dr SW