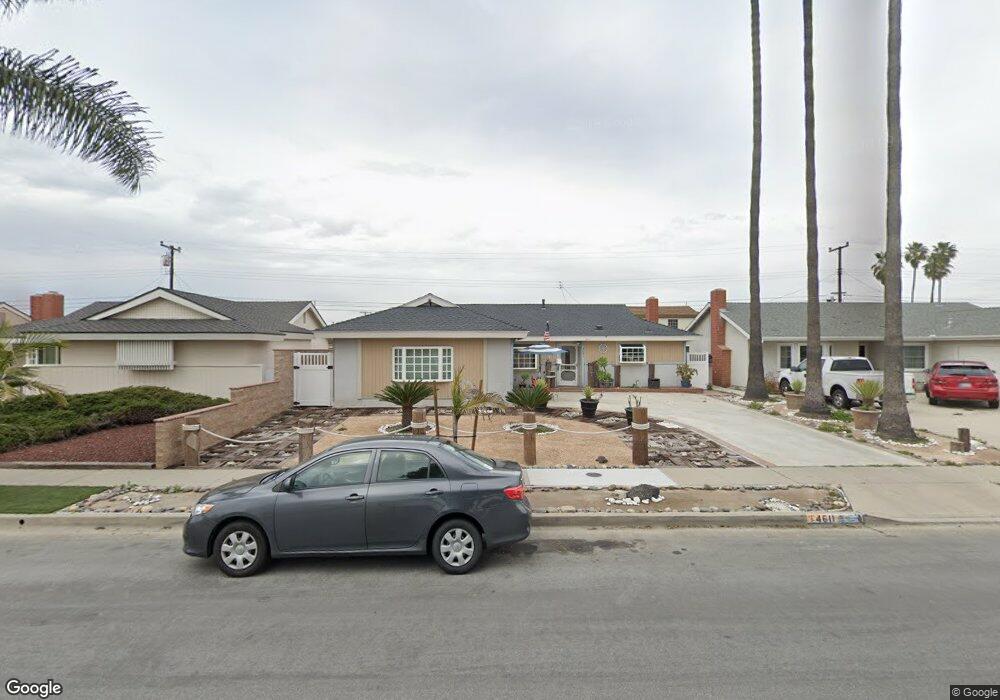
4611 Suite Dr Huntington Beach, CA 92649
Estimated Value: $1,164,000 - $1,426,000
4
Beds
2
Baths
1,279
Sq Ft
$978/Sq Ft
Est. Value
About This Home
This home is located at 4611 Suite Dr, Huntington Beach, CA 92649 and is currently estimated at $1,251,337, approximately $978 per square foot. 4611 Suite Dr is a home located in Orange County with nearby schools including Village View Elementary School, Marine View Middle, and Marina High School.
Ownership History
Date
Name
Owned For
Owner Type
Purchase Details
Closed on
Aug 19, 2005
Sold by
Skjonsby Shawn J
Bought by
Pettit Phillip O
Current Estimated Value
Home Financials for this Owner
Home Financials are based on the most recent Mortgage that was taken out on this home.
Original Mortgage
$536,000
Outstanding Balance
$195,233
Interest Rate
1%
Mortgage Type
Negative Amortization
Estimated Equity
$1,056,104
Purchase Details
Closed on
Dec 10, 2002
Sold by
Skjonsby Linda
Bought by
Skjonsby Shawn J
Home Financials for this Owner
Home Financials are based on the most recent Mortgage that was taken out on this home.
Original Mortgage
$300,000
Interest Rate
2.45%
Purchase Details
Closed on
Oct 21, 1997
Sold by
Skjonsby Shawn J and Skjonsby Linda
Bought by
Skjonsby Shawn J and Skjonsby Linda
Create a Home Valuation Report for This Property
The Home Valuation Report is an in-depth analysis detailing your home's value as well as a comparison with similar homes in the area
Home Values in the Area
Average Home Value in this Area
Purchase History
| Date | Buyer | Sale Price | Title Company |
|---|---|---|---|
| Pettit Phillip O | $670,000 | -- | |
| Skjonsby Shawn J | -- | California Counties Title Co | |
| Skjonsby Shawn J | -- | Old Republic Title Company |
Source: Public Records
Mortgage History
| Date | Status | Borrower | Loan Amount |
|---|---|---|---|
| Open | Pettit Phillip O | $536,000 | |
| Previous Owner | Skjonsby Shawn J | $300,000 |
Source: Public Records
Tax History Compared to Growth
Tax History
| Year | Tax Paid | Tax Assessment Tax Assessment Total Assessment is a certain percentage of the fair market value that is determined by local assessors to be the total taxable value of land and additions on the property. | Land | Improvement |
|---|---|---|---|---|
| 2025 | $10,146 | $915,605 | $825,453 | $90,152 |
| 2024 | $10,146 | $897,652 | $809,267 | $88,385 |
| 2023 | $9,102 | $805,456 | $734,043 | $71,413 |
| 2022 | $8,969 | $789,663 | $719,650 | $70,013 |
| 2021 | $8,804 | $774,180 | $705,539 | $68,641 |
| 2020 | $8,792 | $774,180 | $705,539 | $68,641 |
| 2019 | $8,636 | $759,000 | $691,704 | $67,296 |
| 2018 | $8,603 | $759,000 | $691,704 | $67,296 |
| 2017 | $7,881 | $691,000 | $623,704 | $67,296 |
| 2016 | $7,699 | $691,000 | $623,704 | $67,296 |
| 2015 | $7,102 | $636,000 | $568,704 | $67,296 |
| 2014 | $6,063 | $540,000 | $472,704 | $67,296 |
Source: Public Records
Map
Nearby Homes
- 16102 Ballad Ln
- 16291 Fantasia Ln
- 16222 Monterey Ln Unit 327
- 16222 Monterey Ln Unit 103
- 16222 Monterey Ln Unit 79
- 16222 Monterey Ln Unit 80
- 16222 Monterey Ln Unit 166
- 16222 Monterey Ln Unit 51
- 16222 Monterey Ln Unit 210
- 16222 Monterey Ln Unit 367
- 16222 Monterey Ln Unit 215
- 16222 Monterey Ln Unit 164
- 16222 Monterey Ln Unit 328
- 16262 Honolulu Ln
- 16052 Waikiki Ln
- 16396 Vista Roma Cir Unit 111
- 16408 Vista Roma Cir Unit 116
- 4648 Vista Bahia Dr Unit 16
- 4951 Maui Cir
- 16451 Makaha Ln