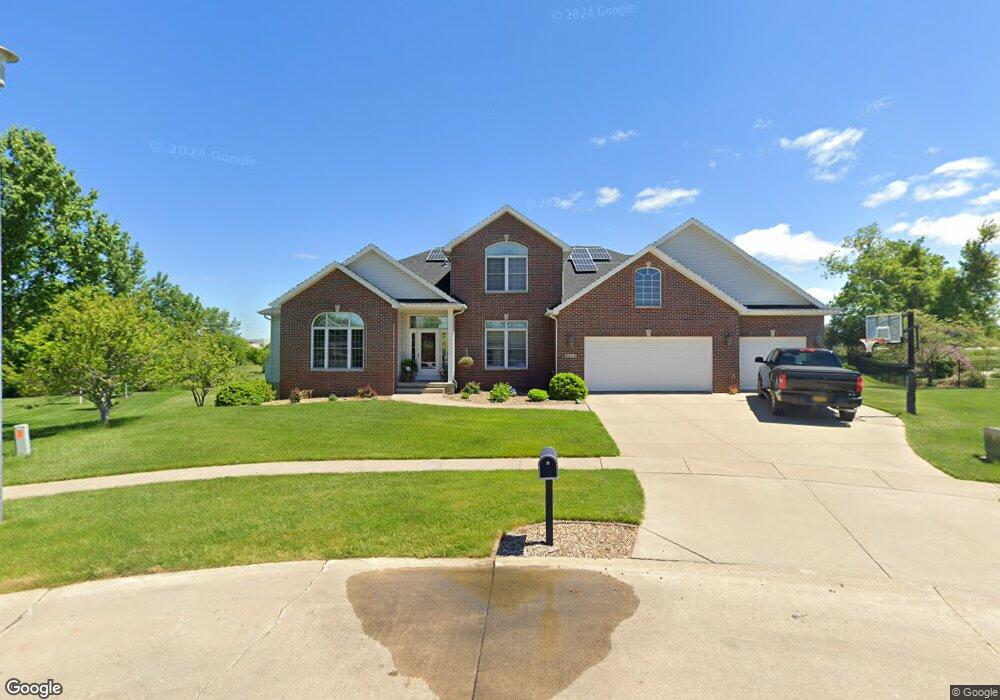
4612 Chestnut Ridge Ct NE Cedar Rapids, IA 52411
Estimated Value: $536,000 - $693,000
5
Beds
4
Baths
4,077
Sq Ft
$145/Sq Ft
Est. Value
About This Home
This home is located at 4612 Chestnut Ridge Ct NE, Cedar Rapids, IA 52411 and is currently estimated at $591,455, approximately $145 per square foot. 4612 Chestnut Ridge Ct NE is a home located in Linn County with nearby schools including T.C. Cherry Elementary School, Viola Gibson Elementary School, and Ponderosa Elementary School.
Ownership History
Date
Name
Owned For
Owner Type
Purchase Details
Closed on
Oct 6, 2020
Sold by
Sunil K Saxena Revocable Trust and Saxena Sunil K
Bought by
Brauer David P and Brauer Alicia A
Current Estimated Value
Home Financials for this Owner
Home Financials are based on the most recent Mortgage that was taken out on this home.
Original Mortgage
$403,750
Outstanding Balance
$357,487
Interest Rate
2.9%
Mortgage Type
New Conventional
Estimated Equity
$233,968
Purchase Details
Closed on
Feb 12, 2015
Sold by
Saxena Abha and Saxena Sunil
Bought by
Saxena Sunil K and Sunil K Saxena Revocable Trust
Purchase Details
Closed on
Jul 11, 2009
Sold by
Koong Su K and Koong Yunis H
Bought by
Saxena Abha and Saxena Sunil
Home Financials for this Owner
Home Financials are based on the most recent Mortgage that was taken out on this home.
Original Mortgage
$389,500
Interest Rate
5.43%
Mortgage Type
Purchase Money Mortgage
Purchase Details
Closed on
Sep 5, 2001
Sold by
C Rdr Homes Inc
Bought by
Koong Su K and Koong Yunis H
Home Financials for this Owner
Home Financials are based on the most recent Mortgage that was taken out on this home.
Original Mortgage
$328,250
Interest Rate
7.03%
Create a Home Valuation Report for This Property
The Home Valuation Report is an in-depth analysis detailing your home's value as well as a comparison with similar homes in the area
Home Values in the Area
Average Home Value in this Area
Purchase History
| Date | Buyer | Sale Price | Title Company |
|---|---|---|---|
| Brauer David P | $425,000 | None Listed On Document | |
| Brauer David P | $679,200 | Oshea Scott M | |
| Saxena Sunil K | -- | None Available | |
| Saxena Abha | $409,500 | None Available | |
| Koong Su K | $410,000 | -- |
Source: Public Records
Mortgage History
| Date | Status | Borrower | Loan Amount |
|---|---|---|---|
| Open | Brauer David P | $403,750 | |
| Previous Owner | Saxena Abha | $389,500 | |
| Previous Owner | Koong Su K | $328,250 |
Source: Public Records
Tax History Compared to Growth
Tax History
| Year | Tax Paid | Tax Assessment Tax Assessment Total Assessment is a certain percentage of the fair market value that is determined by local assessors to be the total taxable value of land and additions on the property. | Land | Improvement |
|---|---|---|---|---|
| 2025 | $8,646 | $503,500 | $95,300 | $408,200 |
| 2024 | $8,758 | $488,600 | $95,300 | $393,300 |
| 2023 | $8,758 | $488,600 | $95,300 | $393,300 |
| 2022 | $7,502 | $424,100 | $84,000 | $340,100 |
| 2021 | $8,142 | $371,100 | $67,200 | $303,900 |
| 2020 | $8,142 | $377,600 | $67,200 | $310,400 |
| 2019 | $7,604 | $361,300 | $67,200 | $294,100 |
| 2018 | $7,390 | $361,300 | $67,200 | $294,100 |
| 2017 | $8,135 | $352,000 | $67,200 | $284,800 |
| 2016 | $8,135 | $382,700 | $67,200 | $315,500 |
| 2015 | $8,933 | $419,794 | $67,238 | $352,556 |
| 2014 | $8,748 | $419,794 | $67,238 | $352,556 |
| 2013 | $8,556 | $419,794 | $67,238 | $352,556 |
Source: Public Records
Map
Nearby Homes
- 4620 N River Blvd NE
- 5180 Chestnut Valley Rd
- 5230 Edgewood Rd NE
- Lot 11 Cross Pointe Blvd NE
- Lot 12 Cross Pointe Blvd NE
- 4620 Prairie Stone Dr NE
- 4408 Prairie Stone Dr NE
- 4510 Prairie Stone Dr NE
- 4104 Treeline Ct NE Unit 4104
- 4105 N Willowbend Rd NE
- Lot 1A Buffalo Ridge Dr NE
- 3719 Blue Mound Dr NE
- 2420 Heritage Green Dr
- 3915 Lexington Dr NE Unit B
- 225 Ridgewood Dr
- 3620 Western Pine Dr NE
- 4113 Lexington Ct NE Unit C
- 4113 Lexington Ct NE Unit A
- 2255 Blairsferry Crossing
- 3608 Foxborough Terrace NE Unit B
- 4606 Chestnut Ridge Ct NE
- 4618 Chestnut Ridge Ct NE
- 4600 Chestnut Ridge Rd NE
- 4702 Chestnut Ridge Rd NE
- 4526 Chestnut Ridge Rd NE
- Lot 17 Edgewood Pointe
- 4617 Chestnut Ridge Rd NE
- 4518 Chestnut Ridge Rd NE
- 4701 Chestnut Ridge Rd NE
- 4607 Chestnut Ridge Rd NE
- 4525 Chestnut Ridge Rd NE
- 4712 Chestnut Ridge Rd NE
- 4711 Chestnut Ridge Rd NE
- Lot 18 Edgewood Pointe
- 4517 Chestnut Ridge Rd NE
- 4510 Chestnut Ridge Rd NE
- 4840 Millbrook Ct NE
- 4721 Chestnut Ridge Rd NE
- 4904 Millbrook Ct NE
- 0 N River Blvd NE