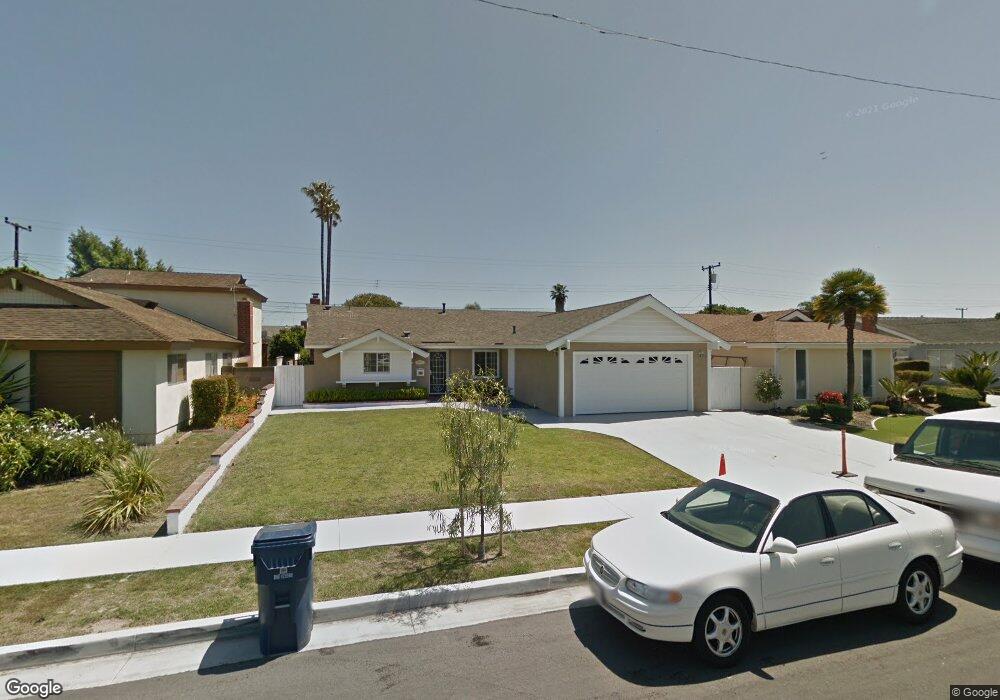
4612 Prelude Dr Huntington Beach, CA 92649
Estimated Value: $1,119,000 - $1,253,000
4
Beds
2
Baths
1,289
Sq Ft
$905/Sq Ft
Est. Value
About This Home
This home is located at 4612 Prelude Dr, Huntington Beach, CA 92649 and is currently estimated at $1,165,968, approximately $904 per square foot. 4612 Prelude Dr is a home located in Orange County with nearby schools including Village View Elementary School, Marine View Middle, and Marina High School.
Ownership History
Date
Name
Owned For
Owner Type
Purchase Details
Closed on
Sep 19, 1997
Sold by
Ray Ankrom Ronald
Bought by
Golin Stephen C and Golin Karen E
Current Estimated Value
Home Financials for this Owner
Home Financials are based on the most recent Mortgage that was taken out on this home.
Original Mortgage
$188,000
Outstanding Balance
$29,186
Interest Rate
7.49%
Estimated Equity
$1,136,782
Purchase Details
Closed on
Apr 7, 1994
Sold by
Buettner Jay Thomas and Buettner Jenny Rebecca
Bought by
Ankrom Ronald Ray
Home Financials for this Owner
Home Financials are based on the most recent Mortgage that was taken out on this home.
Original Mortgage
$199,750
Interest Rate
7.67%
Purchase Details
Closed on
Dec 22, 1993
Sold by
Buettner Jay Thomas
Bought by
Buettner Jay Thomas and Buettner Jenny Rebecca
Create a Home Valuation Report for This Property
The Home Valuation Report is an in-depth analysis detailing your home's value as well as a comparison with similar homes in the area
Home Values in the Area
Average Home Value in this Area
Purchase History
| Date | Buyer | Sale Price | Title Company |
|---|---|---|---|
| Golin Stephen C | $235,000 | Old Republic Title Company | |
| Ankrom Ronald Ray | $235,000 | Gateway Title | |
| Buettner Jay Thomas | -- | Gateway Title |
Source: Public Records
Mortgage History
| Date | Status | Borrower | Loan Amount |
|---|---|---|---|
| Open | Golin Stephen C | $188,000 | |
| Previous Owner | Ankrom Ronald Ray | $199,750 |
Source: Public Records
Tax History Compared to Growth
Tax History
| Year | Tax Paid | Tax Assessment Tax Assessment Total Assessment is a certain percentage of the fair market value that is determined by local assessors to be the total taxable value of land and additions on the property. | Land | Improvement |
|---|---|---|---|---|
| 2025 | $4,344 | $375,228 | $295,540 | $79,688 |
| 2024 | $4,344 | $367,871 | $289,745 | $78,126 |
| 2023 | $4,242 | $360,658 | $284,063 | $76,595 |
| 2022 | $4,177 | $353,587 | $278,493 | $75,094 |
| 2021 | $4,100 | $346,654 | $273,032 | $73,622 |
| 2020 | $4,053 | $343,100 | $270,232 | $72,868 |
| 2019 | $3,984 | $336,373 | $264,933 | $71,440 |
| 2018 | $3,895 | $329,778 | $259,738 | $70,040 |
| 2017 | $3,832 | $323,312 | $254,645 | $68,667 |
| 2016 | $3,678 | $316,973 | $249,652 | $67,321 |
| 2015 | $3,621 | $312,212 | $245,902 | $66,310 |
| 2014 | $3,549 | $306,097 | $241,085 | $65,012 |
Source: Public Records
Map
Nearby Homes
- 16102 Ballad Ln
- 16291 Fantasia Ln
- 16222 Monterey Ln Unit 327
- 16222 Monterey Ln Unit 103
- 16222 Monterey Ln Unit 79
- 16222 Monterey Ln Unit 80
- 16222 Monterey Ln Unit 166
- 16222 Monterey Ln Unit 51
- 16222 Monterey Ln Unit 210
- 16222 Monterey Ln Unit 367
- 16222 Monterey Ln Unit 215
- 16222 Monterey Ln Unit 164
- 16222 Monterey Ln Unit 328
- 16262 Honolulu Ln
- 16052 Waikiki Ln
- 16396 Vista Roma Cir Unit 111
- 16408 Vista Roma Cir Unit 116
- 4648 Vista Bahia Dr Unit 16
- 4951 Maui Cir
- 16451 Makaha Ln
- 4602 Prelude Dr
- 4622 Prelude Dr
- 4611 Suite Dr
- 4601 Suite Dr
- 4621 Suite Dr
- 4592 Prelude Dr
- 4632 Prelude Dr
- 16081 Waltz Cir
- 4591 Suite Dr
- 4631 Suite Dr
- 4642 Prelude Dr
- 4582 Prelude Dr
- 16082 Waltz Cir
- 4581 Suite Dr
- 4641 Suite Dr
- 16082 Aria Cir
- 16071 Waltz Cir
- 4572 Prelude Dr
- 16072 Waltz Cir
- 16072 Aria Cir