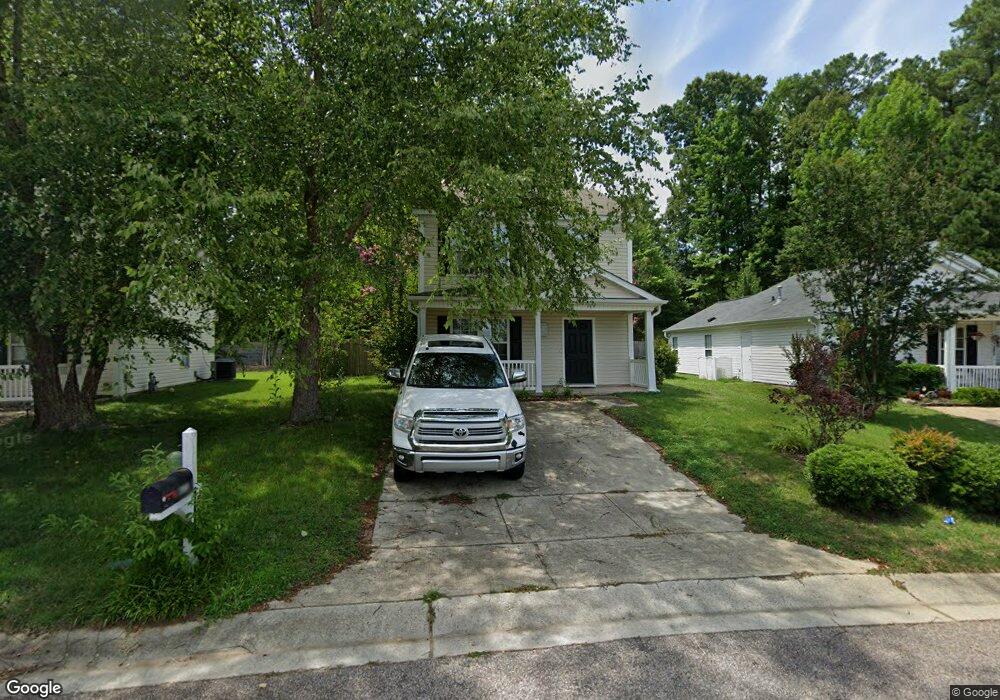
4612 Silverdene St Raleigh, NC 27616
Northeast Raleigh NeighborhoodEstimated Value: $289,000 - $324,000
3
Beds
3
Baths
1,325
Sq Ft
$233/Sq Ft
Est. Value
About This Home
This home is located at 4612 Silverdene St, Raleigh, NC 27616 and is currently estimated at $309,120, approximately $233 per square foot. 4612 Silverdene St is a home located in Wake County with nearby schools including Sanford Creek Elementary School, River Bend Middle, and Rolesville High School.
Ownership History
Date
Name
Owned For
Owner Type
Purchase Details
Closed on
Nov 14, 2018
Sold by
Sllverwood Capital Llc
Bought by
Bai Yuhan J
Current Estimated Value
Home Financials for this Owner
Home Financials are based on the most recent Mortgage that was taken out on this home.
Original Mortgage
$142,500
Outstanding Balance
$125,044
Interest Rate
4.7%
Mortgage Type
New Conventional
Estimated Equity
$184,076
Purchase Details
Closed on
Aug 20, 2018
Sold by
Davis Ronald H and White Francis S
Bought by
Silverwood Capital Llc
Purchase Details
Closed on
May 27, 1999
Sold by
Beazer Homes Corp
Bought by
Palchey Mikhail and Palchey Yelena
Home Financials for this Owner
Home Financials are based on the most recent Mortgage that was taken out on this home.
Original Mortgage
$114,038
Interest Rate
6.84%
Mortgage Type
FHA
Create a Home Valuation Report for This Property
The Home Valuation Report is an in-depth analysis detailing your home's value as well as a comparison with similar homes in the area
Home Values in the Area
Average Home Value in this Area
Purchase History
| Date | Buyer | Sale Price | Title Company |
|---|---|---|---|
| Bai Yuhan J | $150,000 | None Available | |
| Silverwood Capital Llc | $40,000 | None Available | |
| Palchey Mikhail | $116,000 | -- |
Source: Public Records
Mortgage History
| Date | Status | Borrower | Loan Amount |
|---|---|---|---|
| Open | Bai Yuhan J | $142,500 | |
| Previous Owner | Palchey Mikhail | $114,038 |
Source: Public Records
Tax History Compared to Growth
Tax History
| Year | Tax Paid | Tax Assessment Tax Assessment Total Assessment is a certain percentage of the fair market value that is determined by local assessors to be the total taxable value of land and additions on the property. | Land | Improvement |
|---|---|---|---|---|
| 2025 | $2,772 | $315,517 | $110,000 | $205,517 |
| 2024 | $2,760 | $315,517 | $110,000 | $205,517 |
| 2023 | $1,759 | $159,528 | $50,000 | $109,528 |
| 2022 | $1,635 | $159,528 | $50,000 | $109,528 |
| 2021 | $1,572 | $159,528 | $50,000 | $109,528 |
| 2020 | $1,544 | $159,528 | $50,000 | $109,528 |
| 2019 | $1,545 | $131,576 | $40,000 | $91,576 |
| 2018 | $1,458 | $131,576 | $40,000 | $91,576 |
| 2017 | $1,389 | $131,576 | $40,000 | $91,576 |
| 2016 | $1,360 | $131,576 | $40,000 | $91,576 |
| 2015 | $1,389 | $132,218 | $36,000 | $96,218 |
| 2014 | $1,318 | $132,218 | $36,000 | $96,218 |
Source: Public Records
Map
Nearby Homes
- 5012 Silverdene St
- 5325 Marthonna Way
- 4800 Arbor Lodge Dr
- 5200 Fieldwood Ct
- 4821 Heathshire Dr
- 4809 Kaycee Ct
- 5208 Windmere Chase Dr
- 4809 Elmhurst Ridge Ct
- 4416 Walker Hallow St
- 4416 Brintons Cottage St
- 4508 Brintons Cottage St
- 4721 Mocha Ln
- 4236 Saubranch Hill St
- 4625 Fox Rd
- 4804 Spring Forest Rd
- 4416 Major Loring Way
- 4440 Cardinal Grove Blvd
- 4604 Treadstone Ct
- 4252 Rockdell Hall St
- 5320 Spring Pines Way
- 4616 Silverdene St
- 4608 Silverdene St
- 4620 Silverdene St
- 4604 Silverdene St
- 4624 Silverdene St
- 4613 Silverdene St
- 4809 Bluetick Rd
- 4609 Silverdene St
- 5101 Silverdene St
- 4600 Silverdene St
- 4628 Silverdene St
- 4617 Silverdene St
- 5105 Silverdene St
- 4812 Bluetick Rd
- 4625 Silverdene St
- 4601 Silverdene St
- 5033 Silverdene St
- 4700 Silverdene St
- 5109 Silverdene St
- 4629 Silverdene St