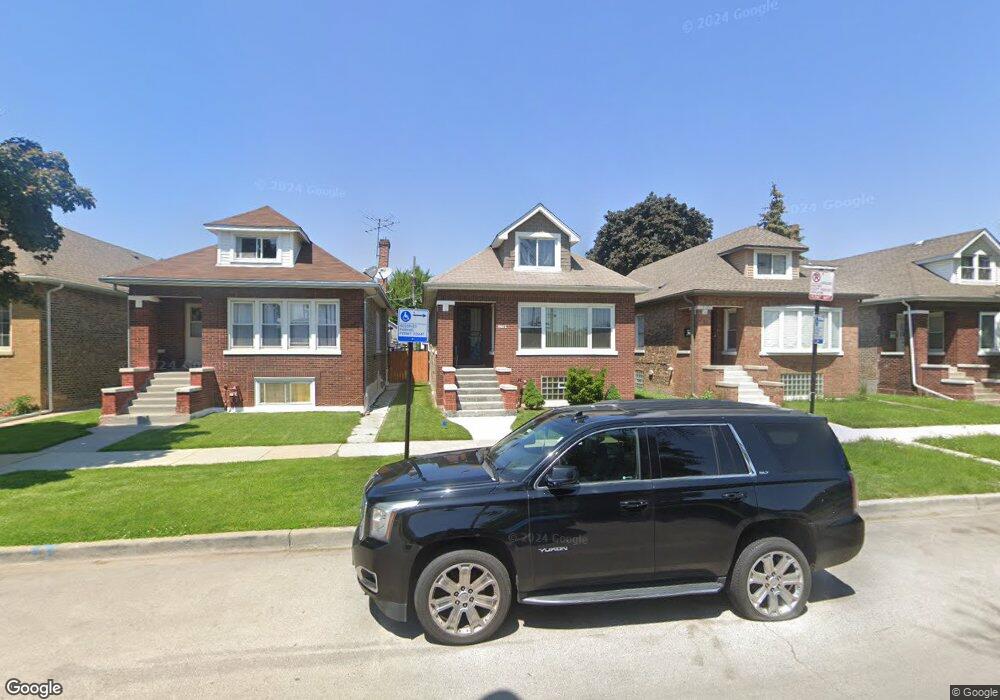
4612 W Dickens Ave Chicago, IL 60639
Hermosa NeighborhoodEstimated Value: $285,000 - $416,000
2
Beds
1
Bath
1,005
Sq Ft
$353/Sq Ft
Est. Value
About This Home
This home is located at 4612 W Dickens Ave, Chicago, IL 60639 and is currently estimated at $354,320, approximately $352 per square foot. 4612 W Dickens Ave is a home located in Cook County with nearby schools including Lloyd Elementary School, Northwest Middle School, and Foreman College and Career Academy.
Ownership History
Date
Name
Owned For
Owner Type
Purchase Details
Closed on
May 5, 2005
Sold by
Kelley Clarence L
Bought by
Kelley Clarence A and Kelley Brent Earline
Current Estimated Value
Purchase Details
Closed on
May 13, 2000
Sold by
Kelly Clarence A and Kelly Brent Earline
Bought by
Brent Earline and Kelley Marie
Home Financials for this Owner
Home Financials are based on the most recent Mortgage that was taken out on this home.
Original Mortgage
$136,000
Outstanding Balance
$56,367
Interest Rate
10.95%
Estimated Equity
$297,953
Purchase Details
Closed on
May 2, 2000
Sold by
Kelly Clarence A and Kelly Brent Earline
Bought by
Kelly Clarence A and Kelly Brent Earline
Home Financials for this Owner
Home Financials are based on the most recent Mortgage that was taken out on this home.
Original Mortgage
$136,000
Outstanding Balance
$56,367
Interest Rate
10.95%
Estimated Equity
$297,953
Purchase Details
Closed on
Apr 14, 1994
Sold by
Nieves Jaime W and Nieves Olga I
Bought by
Kelly Clarence A and Kelly Brent Earline
Home Financials for this Owner
Home Financials are based on the most recent Mortgage that was taken out on this home.
Original Mortgage
$95,584
Interest Rate
7.51%
Mortgage Type
FHA
Create a Home Valuation Report for This Property
The Home Valuation Report is an in-depth analysis detailing your home's value as well as a comparison with similar homes in the area
Home Values in the Area
Average Home Value in this Area
Purchase History
| Date | Buyer | Sale Price | Title Company |
|---|---|---|---|
| Kelley Clarence A | -- | -- | |
| Brent Earline | -- | -- | |
| Kelly Clarence A | -- | -- | |
| Kelly Clarence A | $63,333 | -- |
Source: Public Records
Mortgage History
| Date | Status | Borrower | Loan Amount |
|---|---|---|---|
| Open | Brent Earline | $136,000 | |
| Closed | Kelly Clarence A | $95,584 |
Source: Public Records
Tax History Compared to Growth
Tax History
| Year | Tax Paid | Tax Assessment Tax Assessment Total Assessment is a certain percentage of the fair market value that is determined by local assessors to be the total taxable value of land and additions on the property. | Land | Improvement |
|---|---|---|---|---|
| 2024 | $3,584 | $29,000 | $14,452 | $14,548 |
| 2023 | $3,467 | $20,953 | $11,124 | $9,829 |
| 2022 | $3,467 | $20,953 | $11,124 | $9,829 |
| 2021 | $3,756 | $21,999 | $11,124 | $10,875 |
| 2020 | $3,638 | $19,423 | $5,663 | $13,760 |
| 2019 | $3,698 | $21,824 | $5,663 | $16,161 |
| 2018 | $3,634 | $21,824 | $5,663 | $16,161 |
| 2017 | $3,049 | $17,529 | $5,077 | $12,452 |
| 2016 | $3,012 | $17,529 | $5,077 | $12,452 |
| 2015 | $2,733 | $17,529 | $5,077 | $12,452 |
| 2014 | $2,668 | $16,938 | $4,687 | $12,251 |
| 2013 | $2,604 | $16,938 | $4,687 | $12,251 |
Source: Public Records
Map
Nearby Homes
- 4637 W Mclean Ave
- 2016 N Kilbourn Ave
- 2035 N Cicero Ave
- 1930 N Kenneth Ave
- 2323 N Keating Ave
- 1943 N La Crosse Ave
- 2323 N Kilbourn Ave
- 4311 W Palmer St
- 4639 W Montana St
- 1916 N Lowell Ave
- 1912 N Lowell Ave
- 2420 N Kilbourn Ave
- 4624 W Montana St
- 4630 W Montana St
- 1748 N Keating Ave
- 2218 N Lavergne Ave
- 4420 W Montana St
- 4610 W Altgeld St
- 2225 N Tripp Ave
- 2134 N Keeler Ave
- 4614 W Dickens Ave
- 4608 W Dickens Ave
- 4618 W Dickens Ave
- 4606 W Dickens Ave
- 4622 W Dickens Ave
- 4602 W Dickens Ave
- 4624 W Dickens Ave
- 4613 W Shakespeare Ave
- 4617 W Shakespeare Ave
- 4609 W Shakespeare Ave
- 4628 W Dickens Ave
- 4619 W Shakespeare Ave
- 4607 W Shakespeare Ave
- 4623 W Shakespeare Ave
- 4603 W Shakespeare Ave
- 4630 W Dickens Ave
- 4625 W Shakespeare Ave
- 4617 W Dickens Ave
- 4621 W Dickens Ave
- 4629 W Shakespeare Ave