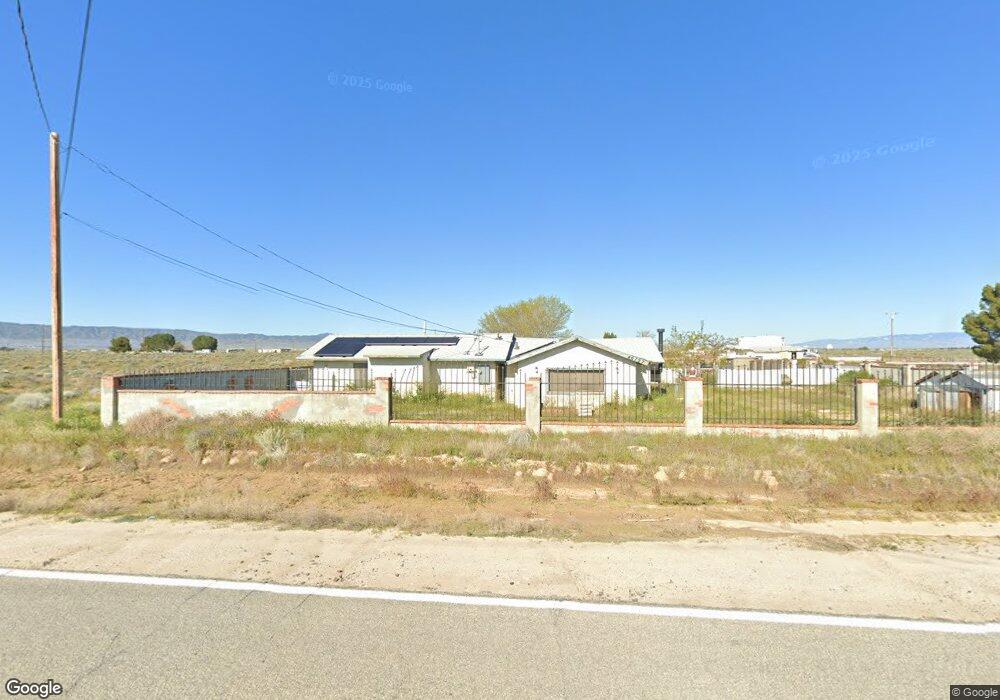
46127 50th St W Lancaster, CA 93536
West Lancaster NeighborhoodEstimated Value: $567,000 - $752,308
5
Beds
2
Baths
3,696
Sq Ft
$183/Sq Ft
Est. Value
About This Home
This home is located at 46127 50th St W, Lancaster, CA 93536 and is currently estimated at $678,077, approximately $183 per square foot. 46127 50th St W is a home located in Los Angeles County with nearby schools including Del Sur Senior Elementary School, Lancaster High School, and Fabunni Private School Inc..
Ownership History
Date
Name
Owned For
Owner Type
Purchase Details
Closed on
Aug 28, 2001
Sold by
Poitevint Randy
Bought by
Gile Stephanie and Poitevint Randy
Current Estimated Value
Home Financials for this Owner
Home Financials are based on the most recent Mortgage that was taken out on this home.
Original Mortgage
$210,000
Outstanding Balance
$92,286
Interest Rate
8.75%
Estimated Equity
$585,791
Purchase Details
Closed on
Jan 21, 2000
Sold by
Washington Mutual Bank Fa
Bought by
Poitevint Randy
Home Financials for this Owner
Home Financials are based on the most recent Mortgage that was taken out on this home.
Original Mortgage
$100,000
Interest Rate
8.26%
Purchase Details
Closed on
May 14, 1999
Sold by
Baker John C and Baker Jo Ann
Bought by
Washington Mutual Bank Fa
Create a Home Valuation Report for This Property
The Home Valuation Report is an in-depth analysis detailing your home's value as well as a comparison with similar homes in the area
Home Values in the Area
Average Home Value in this Area
Purchase History
| Date | Buyer | Sale Price | Title Company |
|---|---|---|---|
| Gile Stephanie | -- | First American Title Co | |
| Poitevint Randy | $125,000 | Stewart Title Company | |
| Washington Mutual Bank Fa | $104,236 | Stewart Title |
Source: Public Records
Mortgage History
| Date | Status | Borrower | Loan Amount |
|---|---|---|---|
| Open | Gile Stephanie | $210,000 | |
| Closed | Poitevint Randy | $100,000 | |
| Closed | Poitevint Randy | $25,000 |
Source: Public Records
Tax History Compared to Growth
Tax History
| Year | Tax Paid | Tax Assessment Tax Assessment Total Assessment is a certain percentage of the fair market value that is determined by local assessors to be the total taxable value of land and additions on the property. | Land | Improvement |
|---|---|---|---|---|
| 2025 | $5,329 | $402,835 | $22,147 | $380,688 |
| 2024 | $5,329 | $394,937 | $21,713 | $373,224 |
| 2023 | $5,278 | $387,194 | $21,288 | $365,906 |
| 2022 | $5,178 | $379,603 | $20,871 | $358,732 |
| 2021 | $5,064 | $372,161 | $20,462 | $351,699 |
| 2020 | $5,001 | $368,346 | $20,253 | $348,093 |
| 2019 | $4,918 | $361,124 | $19,856 | $341,268 |
| 2018 | $4,703 | $354,044 | $19,467 | $334,577 |
| 2016 | $4,403 | $340,298 | $18,712 | $321,586 |
| 2015 | $4,346 | $335,187 | $18,431 | $316,756 |
| 2014 | $4,340 | $328,622 | $18,070 | $310,552 |
Source: Public Records
Map
Nearby Homes
- 0 50th St W Unit BB24228637
- 0 Avenue G12 & 47th St W
- 0 Apprx 47th Stw North of Ave G8
- 3001 W Avenue H
- 6700 W Avenue H
- 57 W Avenue H
- 48th Street West & Avenue G5
- 0 48 Street West & Avenue G5 Unit 24007150
- 0 41st St W & Ave G-8
- 0
- AVE F PAV VIC 55th St W Unit AVE F PAV VIC 55th S
- 0 Apprx W Ave G11 43rd St W
- 0 Vac Ave G(pav) Vic 53th Stw Unit 24009014
- 0 46th St W & Ave G-2 Unit 25004473
- 92 W Avenue G
- 21000 W Avenue G
- 16 W Avenue G
- 16 Street W Avenue G
- 0 W Ave H8 55th St W Unit 24000351
- 0 W Ave H Vic 40th Stw Unit 24004512
- 0 Ave E 50th St W Unit H09118253
- 0 W 50th St Unit P720168
- 0 W 50th St Unit 277583
- 0 W 50th St Unit 284701
- 0 W 50th St Unit 285473
- 0 W 50th St Unit 295821
- 0 W 50th St Unit 1311628
- 0 W 50th St Unit 1311954
- 0 W 50th St Unit 1500919
- 0 W 50th St Unit 20007060
- 0 50th St W Unit S641976
- 0 50th St W Unit CC331833
- 0 50th St W Unit SW17210886
- 0 50th St W Unit TR15013903
- 0 50th St W Unit CRSR24191917
- 0 50th St W Unit CRBB24228637
- 0 50th St W Unit CV23044050
- 0 50th St W Unit 247989
- 0 50th St W Unit W/g-8 286350
- 0 50th St W Unit 289813