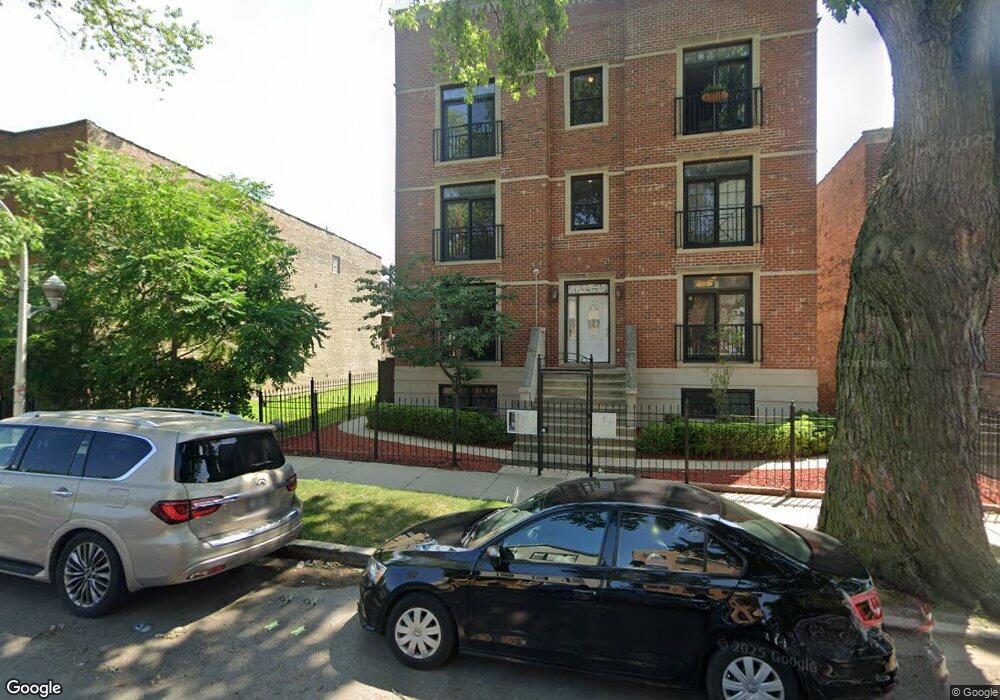
4613 S Langley Ave Unit 3S Chicago, IL 60653
Grand Boulevard NeighborhoodEstimated Value: $239,000 - $281,335
2
Beds
2
Baths
1,500
Sq Ft
$175/Sq Ft
Est. Value
About This Home
This home is located at 4613 S Langley Ave Unit 3S, Chicago, IL 60653 and is currently estimated at $262,584, approximately $175 per square foot. 4613 S Langley Ave Unit 3S is a home located in Cook County with nearby schools including Woodson South Elementary School, Bronzeville Academy Charter School, and UChicago Charter Carter G. Woodson Campus.
Ownership History
Date
Name
Owned For
Owner Type
Purchase Details
Closed on
May 18, 2021
Sold by
Norman Robert L
Bought by
Norman Robert L
Current Estimated Value
Home Financials for this Owner
Home Financials are based on the most recent Mortgage that was taken out on this home.
Original Mortgage
$125,000
Interest Rate
3.13%
Mortgage Type
Balloon
Purchase Details
Closed on
Jul 25, 2006
Sold by
C & T Builders Inc
Bought by
Norman Robert L
Home Financials for this Owner
Home Financials are based on the most recent Mortgage that was taken out on this home.
Original Mortgage
$156,000
Interest Rate
6.73%
Mortgage Type
Purchase Money Mortgage
Create a Home Valuation Report for This Property
The Home Valuation Report is an in-depth analysis detailing your home's value as well as a comparison with similar homes in the area
Home Values in the Area
Average Home Value in this Area
Purchase History
| Date | Buyer | Sale Price | Title Company |
|---|---|---|---|
| Norman Robert L | -- | None Listed On Document | |
| Norman Robert L | $214,000 | Chicago Title Insurance Co |
Source: Public Records
Mortgage History
| Date | Status | Borrower | Loan Amount |
|---|---|---|---|
| Previous Owner | Norman Robert L | $125,000 | |
| Previous Owner | Norman Robert L | $156,000 |
Source: Public Records
Tax History Compared to Growth
Tax History
| Year | Tax Paid | Tax Assessment Tax Assessment Total Assessment is a certain percentage of the fair market value that is determined by local assessors to be the total taxable value of land and additions on the property. | Land | Improvement |
|---|---|---|---|---|
| 2024 | $3,532 | $26,439 | $3,517 | $22,922 |
| 2023 | $3,421 | $20,001 | $3,517 | $16,484 |
| 2022 | $3,421 | $20,001 | $3,517 | $16,484 |
| 2021 | $3,362 | $19,999 | $3,516 | $16,483 |
| 2020 | $1,655 | $10,531 | $1,707 | $8,824 |
| 2019 | $1,644 | $11,613 | $1,707 | $9,906 |
| 2018 | $1,615 | $11,613 | $1,707 | $9,906 |
| 2017 | $1,267 | $9,263 | $1,406 | $7,857 |
| 2016 | $1,355 | $9,263 | $1,406 | $7,857 |
| 2015 | $1,217 | $9,263 | $1,406 | $7,857 |
| 2014 | $112 | $3,170 | $1,205 | $1,965 |
| 2013 | $2,769 | $17,855 | $1,205 | $16,650 |
Source: Public Records
Map
Nearby Homes
- 715 E 46th St
- 4537 S Evans Ave
- 4546 S Cottage Grove Ave
- 4231 S Champlain Ave
- 4714 S Evans Ave Unit 3N
- 544 E 46th Place
- 4520 S Saint Lawrence Ave
- 4706 S Saint Lawrence Ave Unit 2E
- 4704 S Saint Lawrence Ave Unit 2W
- 4704 S Saint Lawrence Ave Unit 2E
- 4704 S Saint Lawrence Ave Unit 4W
- 4704 S Saint Lawrence Ave Unit 3E
- 4704 S Saint Lawrence Ave Unit 4E
- 4704 S Saint Lawrence Ave Unit 3W
- 4730 S Champlain Ave Unit 3
- 4743 S Champlain Ave
- 4757 S Langley Ave
- 834 E 45th St
- 530 E 44th Place
- 4755 S St Lawrence Ave Unit B3
- 4617 S Langley Ave Unit 1S
- 4617 S Langley Ave Unit 2S
- 4613 S Langley Ave Unit 2N
- 4613 S Langley Ave Unit 1N
- 4613 S Langley Ave Unit 3N
- 4613 S Langley Ave Unit 2S
- 4613 S Langley Ave Unit 1S
- 4613 S Langley Ave Unit 1
- 4613 S Langley Ave Unit 3
- 4619 S Langley Ave
- 4619 S Langley Ave Unit 2
- 4619 S Langley Ave
- 4623 S Langley Ave Unit 1
- 4623 S Langley Ave Unit 2
- 4623 S Langley Ave Unit 3
- 4625 S Langley Ave
- 4625 S Langley Ave Unit 1
- 4625 S Langley Ave
- 4625 S Langley Ave Unit 2
- 4609 S Langley Ave