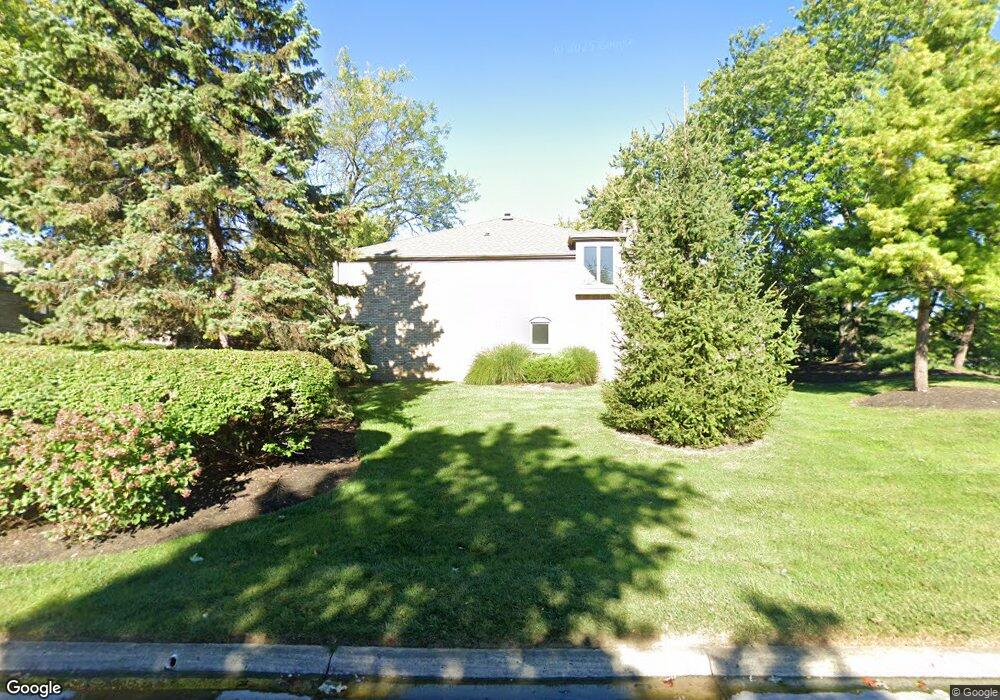
4613 Sandringham Dr Columbus, OH 43220
Estimated Value: $358,009 - $389,000
3
Beds
3
Baths
1,880
Sq Ft
$201/Sq Ft
Est. Value
About This Home
This home is located at 4613 Sandringham Dr, Columbus, OH 43220 and is currently estimated at $377,502, approximately $200 per square foot. 4613 Sandringham Dr is a home located in Franklin County with nearby schools including Greensview Elementary School, Hastings Middle School, and Upper Arlington High School.
Ownership History
Date
Name
Owned For
Owner Type
Purchase Details
Closed on
Jan 13, 2020
Sold by
Kim Kimberly
Bought by
Johnson Dalyn
Current Estimated Value
Home Financials for this Owner
Home Financials are based on the most recent Mortgage that was taken out on this home.
Original Mortgage
$195,000
Outstanding Balance
$172,290
Interest Rate
3.6%
Mortgage Type
Future Advance Clause Open End Mortgage
Estimated Equity
$205,212
Purchase Details
Closed on
Sep 1, 2003
Sold by
Kim Duck B
Bought by
Kim Kimberly
Purchase Details
Closed on
Apr 24, 2002
Sold by
Koo Young W and Koo Chung H
Bought by
Kim Duck B and Kim Kimberly
Home Financials for this Owner
Home Financials are based on the most recent Mortgage that was taken out on this home.
Original Mortgage
$128,000
Interest Rate
7.24%
Mortgage Type
Stand Alone Second
Purchase Details
Closed on
Aug 17, 1992
Bought by
Kim Duck B and Kim Kimberly
Purchase Details
Closed on
May 5, 1992
Purchase Details
Closed on
Oct 15, 1987
Create a Home Valuation Report for This Property
The Home Valuation Report is an in-depth analysis detailing your home's value as well as a comparison with similar homes in the area
Home Values in the Area
Average Home Value in this Area
Purchase History
| Date | Buyer | Sale Price | Title Company |
|---|---|---|---|
| Johnson Dalyn | $260,000 | None Available | |
| Kim Kimberly | -- | -- | |
| Kim Duck B | -- | Old Republic Natl Title Ins | |
| Kim Duck B | $112,500 | -- | |
| -- | $103,500 | -- | |
| -- | $115,000 | -- |
Source: Public Records
Mortgage History
| Date | Status | Borrower | Loan Amount |
|---|---|---|---|
| Open | Johnson Dalyn | $195,000 | |
| Previous Owner | Kim Duck B | $128,000 |
Source: Public Records
Tax History Compared to Growth
Tax History
| Year | Tax Paid | Tax Assessment Tax Assessment Total Assessment is a certain percentage of the fair market value that is determined by local assessors to be the total taxable value of land and additions on the property. | Land | Improvement |
|---|---|---|---|---|
| 2024 | $5,637 | $97,370 | $14,000 | $83,370 |
| 2023 | $5,586 | $97,370 | $14,000 | $83,370 |
| 2022 | $5,483 | $78,470 | $15,890 | $62,580 |
| 2021 | $4,854 | $78,470 | $15,890 | $62,580 |
| 2020 | $4,811 | $78,470 | $15,890 | $62,580 |
| 2019 | $5,037 | $68,260 | $13,830 | $54,430 |
| 2018 | $4,370 | $68,260 | $13,830 | $54,430 |
| 2017 | $4,286 | $68,260 | $13,830 | $54,430 |
| 2016 | $3,760 | $55,130 | $13,860 | $41,270 |
| 2015 | $3,731 | $55,130 | $13,860 | $41,270 |
| 2014 | $3,646 | $55,130 | $13,860 | $41,270 |
| 2013 | $2,172 | $61,250 | $15,400 | $45,850 |
Source: Public Records
Map
Nearby Homes
- 1594 Lafayette Dr Unit 1594
- 1610 Lafayette Dr Unit 1610
- 1512 Lafayette Dr Unit B
- 4543 Ducrest Dr
- 4818 -4820 Winterset Dr
- 4924 Reed Rd Unit B
- 4740 Merrifield Place Unit 25
- 1466 Weybridge Rd
- 1360 Langston Dr
- 1835 Willoway Cir N
- 1865 Willoway Cir N Unit 1865
- 1558 Denbigh Dr
- 1739 Paula Dr Unit 1739
- 5111 Portland St
- 5111 Schuylkill St
- 4326 Kenny Rd
- 4710 Charecote Ln Unit D
- 4094 Lyon Dr
- 1033 Folkestone Rd
- 4781 Coach Rd
- 4613 Sandringham Dr Unit B
- 4615 Sandringham Dr Unit 4A
- 4605 Sandringham Dr Unit 1A
- 4617 Sandringham Dr
- 4617 Sandringham Dr Unit 3
- 4617 Sandringham Dr Unit B
- 4607 Sandringham Dr Unit 1B
- 4607 Sandringham Dr Unit B
- 4609 Sandringham Dr
- 4619 Sandringham Dr
- 4611 Sandringham Dr
- 4612 Sandringham Dr
- 4600 Sandringham Dr
- 4610 Sandringham Dr Unit 10B
- 4610 Sandringham Dr Unit B
- 4598 Sandringham Dr Unit 5A
- 1580 Longeaton Dr Unit 88
- 4608 Sandringham Dr Unit 9A
- 1586 Longeaton Dr Unit 1586
- 4596 Sandringham Dr Unit 6B