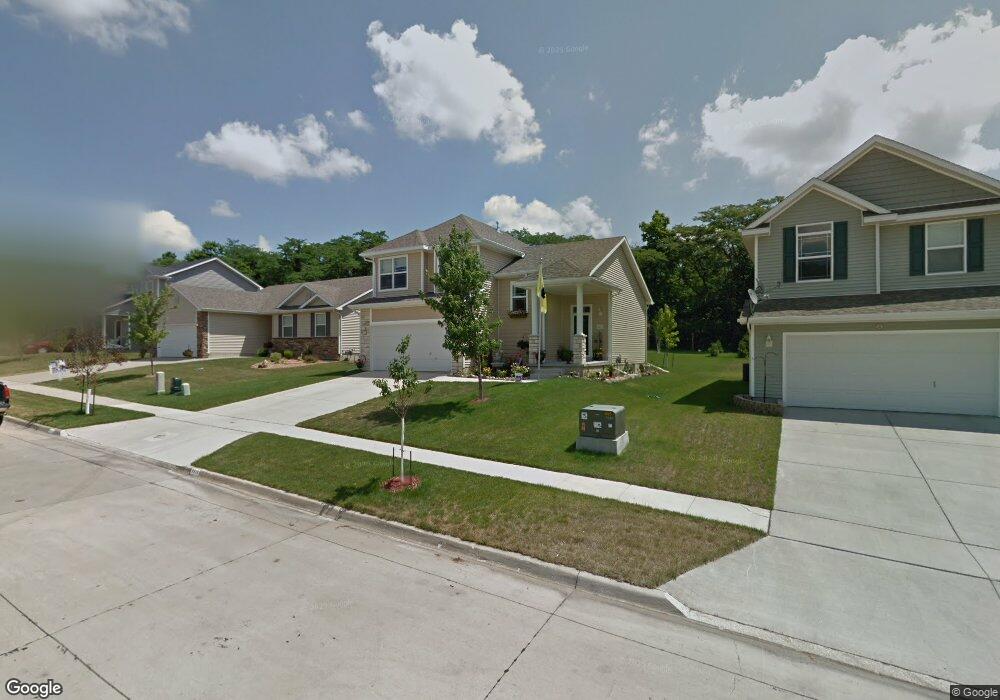
4613 Sawyers Dr Des Moines, IA 50310
Meredith NeighborhoodEstimated Value: $325,000 - $345,000
3
Beds
3
Baths
1,440
Sq Ft
$232/Sq Ft
Est. Value
About This Home
This home is located at 4613 Sawyers Dr, Des Moines, IA 50310 and is currently estimated at $334,740, approximately $232 per square foot. 4613 Sawyers Dr is a home located in Polk County with nearby schools including Lawson Elementary School, Johnston Middle School, and Summit Middle School.
Ownership History
Date
Name
Owned For
Owner Type
Purchase Details
Closed on
Feb 18, 2015
Sold by
Wilson Anthony D and Wilson Michelle A
Bought by
Wilson Anthony D and Wilson Michelle A
Current Estimated Value
Home Financials for this Owner
Home Financials are based on the most recent Mortgage that was taken out on this home.
Original Mortgage
$20,000
Interest Rate
3.6%
Mortgage Type
Unknown
Purchase Details
Closed on
Jul 22, 2009
Sold by
Savannah Homes Inc
Bought by
Wilson Anthony D
Home Financials for this Owner
Home Financials are based on the most recent Mortgage that was taken out on this home.
Original Mortgage
$188,394
Interest Rate
5.62%
Mortgage Type
FHA
Purchase Details
Closed on
Mar 18, 2009
Sold by
Sawyers Landing Llc
Bought by
Savannah Homes Inc
Home Financials for this Owner
Home Financials are based on the most recent Mortgage that was taken out on this home.
Original Mortgage
$142,450
Interest Rate
5.2%
Mortgage Type
Construction
Create a Home Valuation Report for This Property
The Home Valuation Report is an in-depth analysis detailing your home's value as well as a comparison with similar homes in the area
Home Values in the Area
Average Home Value in this Area
Purchase History
| Date | Buyer | Sale Price | Title Company |
|---|---|---|---|
| Wilson Anthony D | -- | None Available | |
| Wilson Anthony D | $191,500 | None Available | |
| Savannah Homes Inc | $41,500 | None Available |
Source: Public Records
Mortgage History
| Date | Status | Borrower | Loan Amount |
|---|---|---|---|
| Closed | Wilson Anthony D | $20,000 | |
| Open | Wilson Anthony D | $176,000 | |
| Previous Owner | Wilson Anthony D | $188,394 | |
| Previous Owner | Savannah Homes Inc | $142,450 |
Source: Public Records
Tax History Compared to Growth
Tax History
| Year | Tax Paid | Tax Assessment Tax Assessment Total Assessment is a certain percentage of the fair market value that is determined by local assessors to be the total taxable value of land and additions on the property. | Land | Improvement |
|---|---|---|---|---|
| 2025 | $5,462 | $312,600 | $61,400 | $251,200 |
| 2024 | $5,462 | $293,400 | $56,800 | $236,600 |
| 2023 | $5,192 | $293,400 | $56,800 | $236,600 |
| 2022 | $5,722 | $240,700 | $47,900 | $192,800 |
| 2021 | $5,732 | $240,700 | $47,900 | $192,800 |
| 2020 | $5,624 | $229,800 | $45,800 | $184,000 |
| 2019 | $5,544 | $229,800 | $45,800 | $184,000 |
| 2018 | $5,482 | $215,900 | $42,200 | $173,700 |
| 2017 | $5,054 | $215,900 | $42,200 | $173,700 |
| 2016 | $4,376 | $196,300 | $38,400 | $157,900 |
| 2015 | $4,376 | $175,300 | $38,400 | $136,900 |
| 2014 | $550 | $177,800 | $38,600 | $139,200 |
Source: Public Records
Map
Nearby Homes
- 3008 Aurora Ave
- 3214 Brinkwood Rd
- 4461 Lower Beaver Rd
- 4427 Lower Beaver Rd
- 3207 Vilura Pkwy
- 3027 Shawnee Ave
- 3018 Shawnee Ave
- 4017 30th St
- 3103 Lawnview Dr
- 3416 Hillcrest Dr
- 3111 Madison Ave
- 3518 Crestmoor Place
- 2601 Glennor Rd
- 3941 30th St
- 3515 Aurora Ave
- 4114 Martin Luther King Junior Pkwy
- 2601 Sherwood Dr
- 3914 Dosh Rd
- 3913 30th St
- 3015 Seneca Ave
- 4609 Sawyers Dr
- 4617 Sawyers Dr
- 4621 Sawyers Dr
- 2983 Twana Dr
- 4608 Sawyers Dr
- 4701 Sawyers Dr
- 2971 Twana Dr
- 4604 Sawyers Dr
- 4700 Sawyers Dr
- 4705 Sawyers Dr
- 2967 Twana Dr
- 2980 Twana Dr
- 2984 Twana Dr
- 4512 29th St
- 2988 Twana Dr
- 3001 Twana Dr
- 3000 Bel Aire Rd
- 4710 Sawyers Dr
- 4709 Sawyers Dr
- 4517 29th St