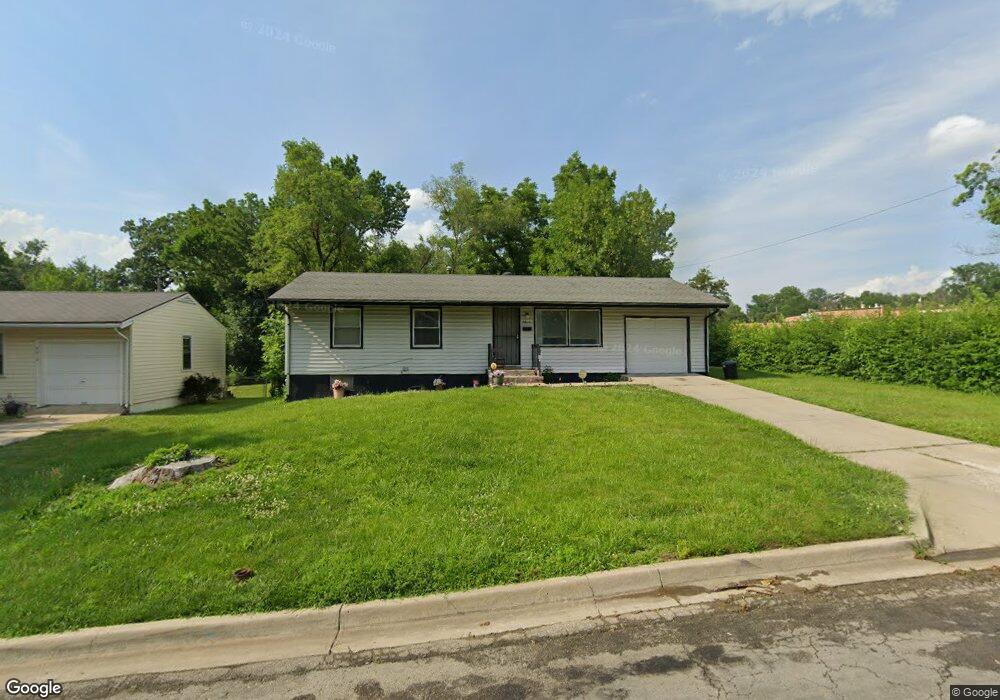
4614 E 40th St Kansas City, MO 64130
Vineyard NeighborhoodEstimated Value: $98,000 - $159,000
3
Beds
2
Baths
912
Sq Ft
$145/Sq Ft
Est. Value
About This Home
This home is located at 4614 E 40th St, Kansas City, MO 64130 and is currently estimated at $132,425, approximately $145 per square foot. 4614 E 40th St is a home located in Jackson County with nearby schools including George Melcher Elementary School, Central Middle School, and Central High School.
Ownership History
Date
Name
Owned For
Owner Type
Purchase Details
Closed on
Aug 29, 2025
Sold by
Sayer Law Group Pc
Bought by
Rapid Revival Llc
Current Estimated Value
Home Financials for this Owner
Home Financials are based on the most recent Mortgage that was taken out on this home.
Original Mortgage
$116,000
Outstanding Balance
$116,000
Interest Rate
6.74%
Mortgage Type
New Conventional
Estimated Equity
$16,425
Purchase Details
Closed on
Oct 20, 2009
Sold by
Deutsche Bank Natl Trust Co
Bought by
Contract Properties Llc
Purchase Details
Closed on
Aug 5, 2009
Sold by
Fields James R
Bought by
Deutsche Bank Natl Trust Co
Purchase Details
Closed on
Dec 21, 2000
Sold by
Beneficial Mtg Co Of Kansas Inc
Bought by
Fields James R
Purchase Details
Closed on
Jun 28, 2000
Sold by
Clark Susie E and Clark Tina L
Bought by
Beneficial Mtg Co Of Kansas Inc
Create a Home Valuation Report for This Property
The Home Valuation Report is an in-depth analysis detailing your home's value as well as a comparison with similar homes in the area
Home Values in the Area
Average Home Value in this Area
Purchase History
| Date | Buyer | Sale Price | Title Company |
|---|---|---|---|
| Rapid Revival Llc | $83,901 | None Listed On Document | |
| Contract Properties Llc | -- | Continental Title | |
| Deutsche Bank Natl Trust Co | $10,400 | None Available | |
| Fields James R | -- | Security Land Title Co | |
| Beneficial Mtg Co Of Kansas Inc | $21,039 | First Financial Title |
Source: Public Records
Mortgage History
| Date | Status | Borrower | Loan Amount |
|---|---|---|---|
| Open | Rapid Revival Llc | $116,000 |
Source: Public Records
Tax History Compared to Growth
Tax History
| Year | Tax Paid | Tax Assessment Tax Assessment Total Assessment is a certain percentage of the fair market value that is determined by local assessors to be the total taxable value of land and additions on the property. | Land | Improvement |
|---|---|---|---|---|
| 2025 | $853 | $5,778 | $2,269 | $3,509 |
| 2024 | $853 | $10,805 | $910 | $9,895 |
| 2023 | $845 | $10,805 | $950 | $9,855 |
| 2022 | $359 | $4,370 | $532 | $3,838 |
| 2021 | $358 | $4,370 | $532 | $3,838 |
| 2020 | $363 | $4,370 | $532 | $3,838 |
| 2019 | $355 | $4,370 | $532 | $3,838 |
| 2018 | $348 | $4,370 | $532 | $3,838 |
| 2017 | $304 | $4,370 | $532 | $3,838 |
| 2016 | $304 | $3,800 | $485 | $3,315 |
| 2014 | $305 | $3,800 | $485 | $3,315 |
Source: Public Records
Map
Nearby Homes
- 3927 Kensington Ave
- 4032 Kensington Ave
- 3920 Spruce Ave
- 5001 E 41st St
- 4919 E 39th St
- 4676 E 37th Terrace
- 5015 E 40th St
- 4216 Cypress Ave
- 4132 Spruce Ave
- 4135 Jackson Ave
- 3721 Elmwood Ave
- 4320 E 43rd St
- 5200 E 39th Terrace
- 4015 Myrtle Ave
- 4220 E 43rd St
- 4329 Spruce Ave
- 4343 Lister Ave
- 4335 Spruce Ave
- 4405 Elmwood Ave
- 3801 Mersington Ave