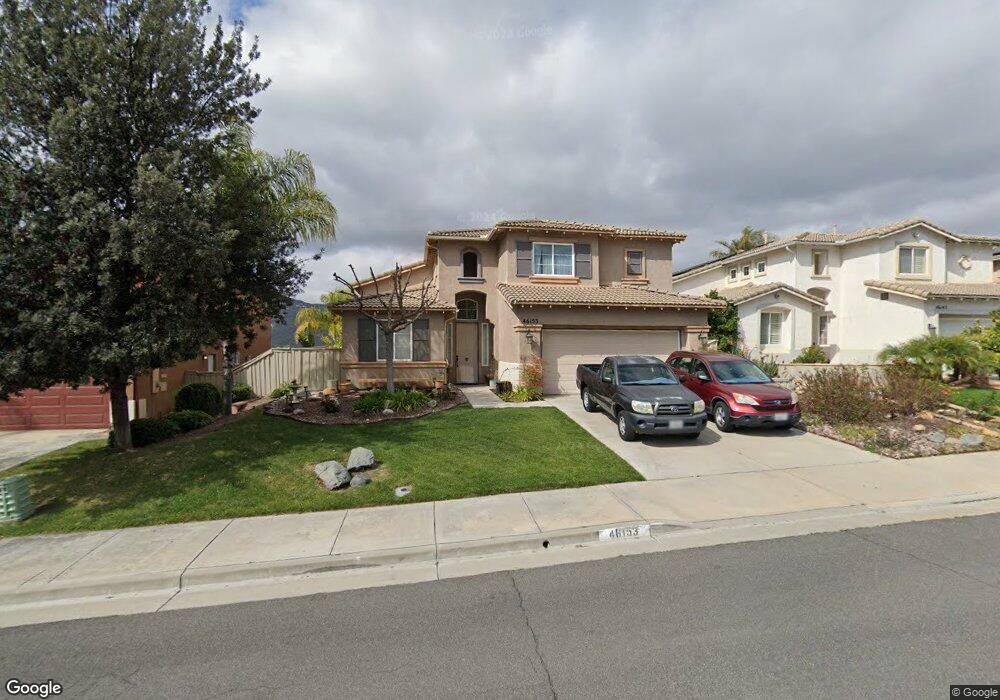
46153 Via la Colorada Temecula, CA 92592
Redhawk NeighborhoodEstimated Value: $735,518 - $802,000
3
Beds
3
Baths
2,342
Sq Ft
$328/Sq Ft
Est. Value
About This Home
This home is located at 46153 Via la Colorada, Temecula, CA 92592 and is currently estimated at $769,130, approximately $328 per square foot. 46153 Via la Colorada is a home located in Riverside County with nearby schools including Helen Hunt Jackson Elementary School, Erle Stanley Gardner Middle School, and Great Oak High School.
Ownership History
Date
Name
Owned For
Owner Type
Purchase Details
Closed on
Feb 6, 2024
Sold by
White Robyn W and White Judith Clements
Bought by
Jubyn Family Trust and White
Current Estimated Value
Purchase Details
Closed on
Nov 22, 2004
Sold by
White Robyn Wayne and White Judith Clements
Bought by
White Robyn W and White Judith Clements
Home Financials for this Owner
Home Financials are based on the most recent Mortgage that was taken out on this home.
Original Mortgage
$109,650
Interest Rate
5.72%
Mortgage Type
New Conventional
Purchase Details
Closed on
Sep 21, 1998
Sold by
Lennar Homes Of California Inc
Bought by
White Robyn Wayne and White Judith Clements
Home Financials for this Owner
Home Financials are based on the most recent Mortgage that was taken out on this home.
Original Mortgage
$155,950
Interest Rate
6.78%
Create a Home Valuation Report for This Property
The Home Valuation Report is an in-depth analysis detailing your home's value as well as a comparison with similar homes in the area
Home Values in the Area
Average Home Value in this Area
Purchase History
| Date | Buyer | Sale Price | Title Company |
|---|---|---|---|
| Jubyn Family Trust | -- | None Listed On Document | |
| White Robyn W | -- | Stewart Title Riverside | |
| White Robyn Wayne | $195,000 | First American Title Co |
Source: Public Records
Mortgage History
| Date | Status | Borrower | Loan Amount |
|---|---|---|---|
| Previous Owner | White Robyn W | $109,650 | |
| Previous Owner | White Robyn Wayne | $155,950 |
Source: Public Records
Tax History Compared to Growth
Tax History
| Year | Tax Paid | Tax Assessment Tax Assessment Total Assessment is a certain percentage of the fair market value that is determined by local assessors to be the total taxable value of land and additions on the property. | Land | Improvement |
|---|---|---|---|---|
| 2025 | $4,895 | $305,677 | $70,533 | $235,144 |
| 2023 | $4,895 | $293,809 | $67,795 | $226,014 |
| 2022 | $4,727 | $288,049 | $66,466 | $221,583 |
| 2021 | $4,624 | $282,402 | $65,163 | $217,239 |
| 2020 | $4,554 | $279,507 | $64,495 | $215,012 |
| 2019 | $4,486 | $274,028 | $63,231 | $210,797 |
| 2018 | $4,394 | $268,656 | $61,992 | $206,664 |
| 2017 | $4,310 | $263,389 | $60,777 | $202,612 |
| 2016 | $4,227 | $258,226 | $59,586 | $198,640 |
| 2015 | $4,147 | $254,349 | $58,692 | $195,657 |
| 2014 | $4,029 | $249,369 | $57,544 | $191,825 |
Source: Public Records
Map
Nearby Homes
- 46186 Via la Tranquila
- 32437 Yosemite Ln
- 46331 Hunter Trail
- 46302 Lone Pine Dr
- 46382 Lone Pine Dr
- 32001 Whitetail Ln
- 45886 Camino Rubi
- 32102 Elk Grove Ct
- 32137 Sycamore Ct
- 45844 Corte Mislanca
- 46053 Drymen Ave
- 31937 Red Pine Way Unit 80
- 31889 Red Pine Way
- 46194 Linda Ct
- 45381 Tiburcio Dr
- 32815 Cleveland St
- 45339 Tiburcio Dr
- 45435 Tioga St
- 31938 Calle Tiara S
- 45344 Saint Tisbury St
- 46145 Via la Colorada
- 46161 Via la Colorada
- 46137 Via la Colorada
- 46169 Via la Colorada
- 46129 Via la Colorada
- 46177 Via la Colorada
- 46149 Via la Tranquila
- 46157 Via la Tranquila
- 46141 Via la Tranquila
- 46121 Via la Colorada
- 46133 Via la Tranquila
- 46240 Durango Dr
- 46185 Via la Colorada
- 46254 Durango Dr
- 46165 Via la Tranquila
- 46125 Via la Tranquila
- 46268 Durango Dr
- 46113 Via la Colorada
- 46226 Durango Dr
- 46193 Via la Colorada