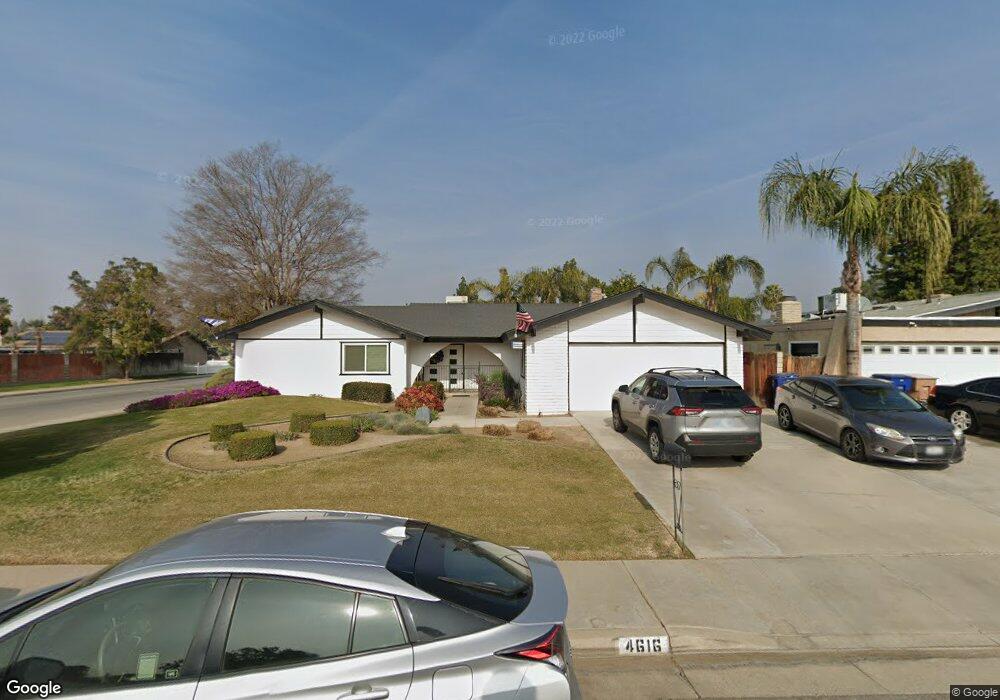
4616 Stanton Way Bakersfield, CA 93309
Park Stockdale NeighborhoodEstimated Value: $321,379 - $344,000
3
Beds
2
Baths
1,412
Sq Ft
$235/Sq Ft
Est. Value
About This Home
This home is located at 4616 Stanton Way, Bakersfield, CA 93309 and is currently estimated at $332,345, approximately $235 per square foot. 4616 Stanton Way is a home located in Kern County with nearby schools including Caroline Harris Elementary School, Curran Middle School, and Bakersfield High School.
Ownership History
Date
Name
Owned For
Owner Type
Purchase Details
Closed on
Nov 9, 2020
Sold by
Reed Casey K
Bought by
Neill Randy D
Current Estimated Value
Home Financials for this Owner
Home Financials are based on the most recent Mortgage that was taken out on this home.
Original Mortgage
$6,450
Outstanding Balance
$5,739
Interest Rate
2.67%
Mortgage Type
New Conventional
Estimated Equity
$326,606
Purchase Details
Closed on
Dec 6, 1996
Sold by
Reed Rosetta Naddine
Bought by
Reed Tony Charles
Home Financials for this Owner
Home Financials are based on the most recent Mortgage that was taken out on this home.
Original Mortgage
$84,816
Interest Rate
7.76%
Mortgage Type
FHA
Purchase Details
Closed on
Dec 2, 1996
Sold by
Reed Tony Charles
Bought by
Reed Casey K
Home Financials for this Owner
Home Financials are based on the most recent Mortgage that was taken out on this home.
Original Mortgage
$84,816
Interest Rate
7.76%
Mortgage Type
FHA
Create a Home Valuation Report for This Property
The Home Valuation Report is an in-depth analysis detailing your home's value as well as a comparison with similar homes in the area
Home Values in the Area
Average Home Value in this Area
Purchase History
| Date | Buyer | Sale Price | Title Company |
|---|---|---|---|
| Neill Randy D | $215,000 | Placer Title Company | |
| Reed Tony Charles | -- | Stewart Title | |
| Reed Casey K | $85,000 | Stewart Title |
Source: Public Records
Mortgage History
| Date | Status | Borrower | Loan Amount |
|---|---|---|---|
| Open | Neill Randy D | $6,450 | |
| Open | Neill Randy D | $208,550 | |
| Previous Owner | Reed Casey K | $84,816 |
Source: Public Records
Tax History Compared to Growth
Tax History
| Year | Tax Paid | Tax Assessment Tax Assessment Total Assessment is a certain percentage of the fair market value that is determined by local assessors to be the total taxable value of land and additions on the property. | Land | Improvement |
|---|---|---|---|---|
| 2025 | $3,310 | $232,721 | $54,121 | $178,600 |
| 2024 | $3,239 | $228,159 | $53,060 | $175,099 |
| 2023 | $3,239 | $223,686 | $52,020 | $171,666 |
| 2022 | $3,166 | $219,300 | $51,000 | $168,300 |
| 2021 | $3,132 | $215,000 | $50,000 | $165,000 |
| 2020 | $1,968 | $126,560 | $37,218 | $89,342 |
| 2019 | $1,928 | $126,560 | $37,218 | $89,342 |
| 2018 | $1,884 | $121,648 | $35,774 | $85,874 |
| 2017 | $1,870 | $119,264 | $35,073 | $84,191 |
| 2016 | $1,725 | $116,927 | $34,386 | $82,541 |
| 2015 | $1,712 | $115,172 | $33,870 | $81,302 |
| 2014 | $1,655 | $112,917 | $33,207 | $79,710 |
Source: Public Records
Map
Nearby Homes
- 4704 Stanton Way
- 198 Pelham Ct
- 4705 La Mirada Dr
- 4500 Perris Way
- 5401 Dunsmuir Rd Unit 30
- 5100 Dunsmuir Rd Unit 3
- 7 Candy St
- 3917 Stockdale Hwy
- 4101 La Mirada Dr
- 207 N Stine Rd
- 113 N Stine Rd
- 113 Griffiths St
- 3800 Stockdale Hwy Unit 3
- 217 Garnsey Ave
- 4425 Charter Oaks Ave
- 507 McDonald Way
- 905 Charter Oaks Ct
- 5500 Lennox Ave Unit 50
- 5500 Lennox Ave Unit 36
- 5500 Lennox Ave Unit 20
- 4612 Stanton Way
- 4613 Perris Way
- 4700 Stanton Way
- 4605 Perris Way
- 4610 Stanton Way
- 4615 Stanton Way
- 4701 Perris Way
- 4613 Stanton Way
- 4601 Perris Way
- 4608 Stanton Way
- 4609 Stanton Way
- 4701 Stanton Way
- 4705 Perris Way
- 4513 Perris Way
- 4705 Stanton Way
- 4616 El Monte Way
- 4612 Perris Way
- 4708 Stanton Way
- 4605 Stanton Way
- 4612 El Monte Way