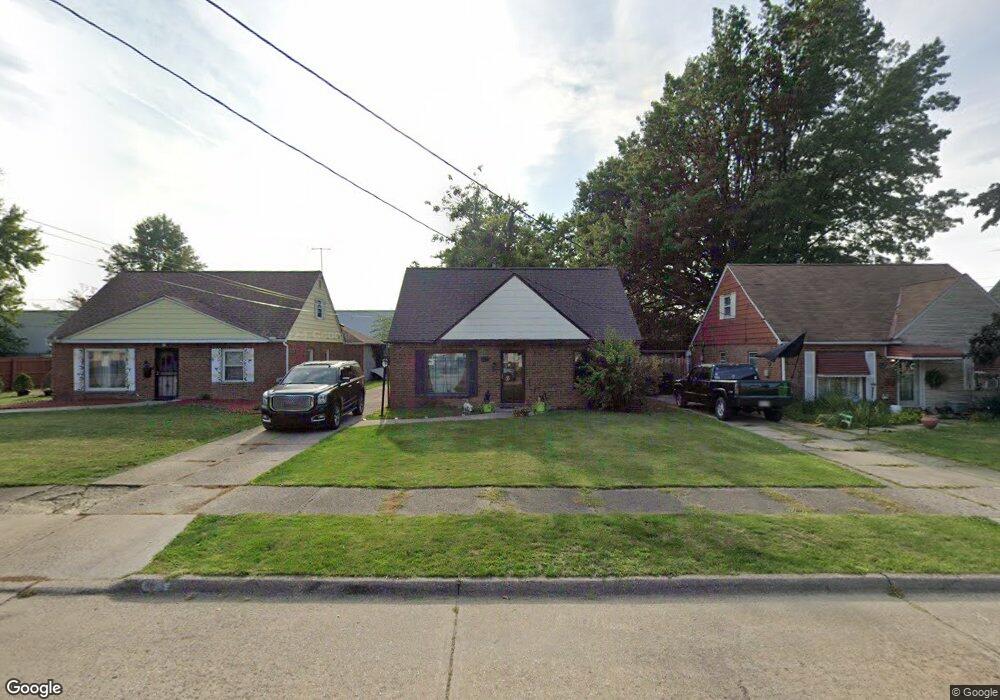
4616 W 158th St Cleveland, OH 44135
Bellaire-Puritas NeighborhoodEstimated Value: $138,000 - $175,000
3
Beds
1
Bath
1,272
Sq Ft
$121/Sq Ft
Est. Value
About This Home
This home is located at 4616 W 158th St, Cleveland, OH 44135 and is currently estimated at $153,651, approximately $120 per square foot. 4616 W 158th St is a home located in Cuyahoga County with nearby schools including Artemus Ward School, Almira Academy, and Benjamin Franklin.
Ownership History
Date
Name
Owned For
Owner Type
Purchase Details
Closed on
Feb 28, 2012
Sold by
Vacha Michael
Bought by
Vacha Michelle
Current Estimated Value
Purchase Details
Closed on
May 26, 2009
Sold by
Beal Bank Ssb
Bought by
Vacha Michael J
Purchase Details
Closed on
Dec 5, 2007
Sold by
Smyrnow Wassily V
Bought by
Beal Bank Ssb
Purchase Details
Closed on
Jun 10, 1994
Sold by
Del Samuel Rio
Bought by
Smyrnow Wassily and Smyrnow Carmen W
Home Financials for this Owner
Home Financials are based on the most recent Mortgage that was taken out on this home.
Original Mortgage
$61,000
Interest Rate
8.45%
Mortgage Type
New Conventional
Purchase Details
Closed on
Apr 18, 1988
Bought by
Delrio Samuel
Purchase Details
Closed on
Aug 28, 1987
Sold by
Binkley Gregory A
Bought by
Ohio Savings Bank
Purchase Details
Closed on
Jun 18, 1979
Sold by
Gallagher Sandra J
Bought by
Binkley Gregory A
Purchase Details
Closed on
Jan 1, 1975
Bought by
Gallagher Sandra J
Create a Home Valuation Report for This Property
The Home Valuation Report is an in-depth analysis detailing your home's value as well as a comparison with similar homes in the area
Home Values in the Area
Average Home Value in this Area
Purchase History
| Date | Buyer | Sale Price | Title Company |
|---|---|---|---|
| Vacha Michelle | -- | None Available | |
| Vacha Michael J | $30,100 | Accu Title Agency | |
| Beal Bank Ssb | $33,334 | Attorney | |
| Smyrnow Wassily | $63,000 | -- | |
| Delrio Samuel | $42,900 | -- | |
| Ohio Savings Bank | -- | -- | |
| Binkley Gregory A | $46,500 | -- | |
| Gallagher Sandra J | -- | -- |
Source: Public Records
Mortgage History
| Date | Status | Borrower | Loan Amount |
|---|---|---|---|
| Previous Owner | Smyrnow Wassily | $61,000 |
Source: Public Records
Tax History Compared to Growth
Tax History
| Year | Tax Paid | Tax Assessment Tax Assessment Total Assessment is a certain percentage of the fair market value that is determined by local assessors to be the total taxable value of land and additions on the property. | Land | Improvement |
|---|---|---|---|---|
| 2024 | $2,772 | $42,280 | $8,295 | $33,985 |
| 2023 | $2,095 | $27,620 | $5,570 | $22,050 |
| 2022 | $2,083 | $27,615 | $5,565 | $22,050 |
| 2021 | $2,062 | $27,620 | $5,570 | $22,050 |
| 2020 | $1,847 | $21,390 | $4,310 | $17,080 |
| 2019 | $1,708 | $61,100 | $12,300 | $48,800 |
| 2018 | $1,702 | $21,390 | $4,310 | $17,080 |
| 2017 | $1,841 | $22,330 | $3,990 | $18,340 |
| 2016 | $1,827 | $22,330 | $3,990 | $18,340 |
| 2015 | $10,222 | $22,330 | $3,990 | $18,340 |
| 2014 | $10,222 | $24,260 | $4,340 | $19,920 |
Source: Public Records
Map
Nearby Homes
- 4636 W 157th St
- 4571 W 157th St
- 4515 W 158th St
- 15617 Mina Ave
- 4704 W 150th St
- 17201 Martha Rd
- 15617 Leigh Ellen Ave
- 4541 W 174th St
- 4484 W 149th St
- 17500 Fairville Ave
- 4688 W 148th St
- 4413 W 173rd St
- 16312 Laverne Ave
- 17422 Puritas Ave
- 4497 W 147th St
- 4267 W 162nd St
- 16701 Elsienna Ave
- 18006 Ponciana Ave
- 4380 W 146th St
- 4494 Rocky River Dr
- 4610 W 158th St
- 4622 W 158th St
- 4606 W 158th St
- 4602 W 158th St
- 4628 W 158th St
- 4617 W 158th St
- 4632 W 158th St
- 4623 W 158th St
- 4611 W 158th St
- 4605 W 158th St
- 4590 W 158th St
- 4629 W 158th St
- 4636 W 158th St
- 4601 W 158th St
- 4633 W 158th St
- 4593 W 158th St
- 4586 W 158th St
- 4640 W 158th St
- 4637 W 158th St
- 4589 W 158th St