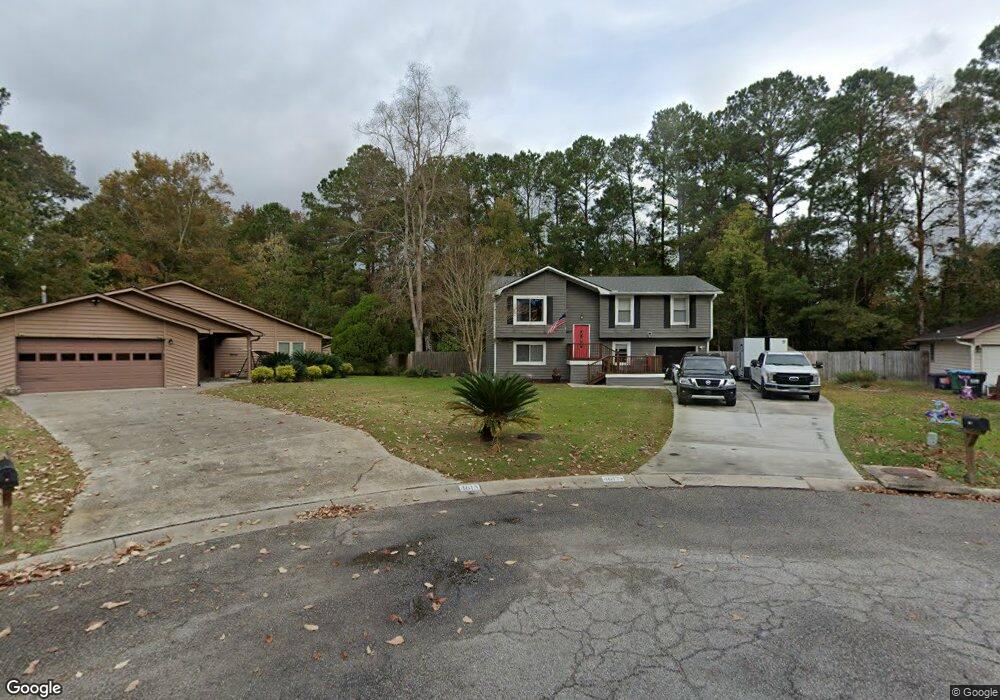
4617 Battery Range North Charleston, SC 29420
Estimated Value: $318,000 - $348,967
4
Beds
2
Baths
1,800
Sq Ft
$184/Sq Ft
Est. Value
About This Home
This home is located at 4617 Battery Range, North Charleston, SC 29420 and is currently estimated at $330,492, approximately $183 per square foot. 4617 Battery Range is a home located in Dorchester County with nearby schools including Eagle Nest Elementary School, River Oaks Middle School, and Fort Dorchester High School.
Ownership History
Date
Name
Owned For
Owner Type
Purchase Details
Closed on
Feb 9, 2022
Sold by
Don Smith Gary
Bought by
Curtis Rebecca L and Curtis George
Current Estimated Value
Home Financials for this Owner
Home Financials are based on the most recent Mortgage that was taken out on this home.
Original Mortgage
$187,200
Outstanding Balance
$173,829
Interest Rate
3.55%
Mortgage Type
New Conventional
Estimated Equity
$156,663
Purchase Details
Closed on
Apr 13, 2010
Sold by
Smith Lynelle Gay and Smith Lynelle G
Bought by
Smith Gary Don and Smith Gary D
Purchase Details
Closed on
Aug 9, 2002
Sold by
Olson Jennifer and Olson Brian S
Bought by
Smith Gary Don and Smith Lynelle Gay
Purchase Details
Closed on
May 30, 2001
Sold by
Va
Bought by
Williams Jennifer L and Olson Brian S
Purchase Details
Closed on
Oct 10, 2000
Sold by
Andrews O B and Andrews Barbara A
Bought by
Va
Create a Home Valuation Report for This Property
The Home Valuation Report is an in-depth analysis detailing your home's value as well as a comparison with similar homes in the area
Home Values in the Area
Average Home Value in this Area
Purchase History
| Date | Buyer | Sale Price | Title Company |
|---|---|---|---|
| Curtis Rebecca L | $234,000 | Weeks & Irvine Llc | |
| Smith Gary Don | -- | -- | |
| Smith Gary Don | $129,900 | -- | |
| Williams Jennifer L | $115,640 | -- | |
| Va | $2,500 | -- |
Source: Public Records
Mortgage History
| Date | Status | Borrower | Loan Amount |
|---|---|---|---|
| Open | Curtis Rebecca L | $187,200 |
Source: Public Records
Tax History Compared to Growth
Tax History
| Year | Tax Paid | Tax Assessment Tax Assessment Total Assessment is a certain percentage of the fair market value that is determined by local assessors to be the total taxable value of land and additions on the property. | Land | Improvement |
|---|---|---|---|---|
| 2024 | $1,698 | $9,375 | $3,400 | $5,975 |
| 2023 | $1,698 | $9,375 | $3,400 | $5,975 |
| 2022 | $1,296 | $6,850 | $1,380 | $5,470 |
| 2021 | $3,855 | $10,280 | $2,070 | $8,210 |
| 2020 | $3,723 | $171,362 | $0 | $0 |
| 2019 | $3,667 | $171,362 | $0 | $0 |
| 2018 | $3,114 | $8,940 | $1,800 | $7,140 |
| 2017 | $3,105 | $8,940 | $1,800 | $7,140 |
| 2016 | $3,062 | $8,940 | $1,800 | $7,140 |
| 2015 | $3,057 | $8,940 | $1,800 | $7,140 |
| 2014 | -- | $153,065 | $0 | $0 |
Source: Public Records
Map
Nearby Homes
- 4606 Moss Ct
- 8464 Athens Way
- 5343 Tidewater Dr
- 3239 Landing Pkwy
- 4723 Cotillion Dr
- 1312 Garland St
- 110 Marsh Hall Dr
- 125 Remington Dr
- 4912 Chartwell Dr
- 8610 Heatherglen Ct
- 0 Dorchester Rd Unit 24030438
- 5437 River Island Ct
- 5360 Greggs Landing
- 5318 Natures Color Ln
- 8328 Berringer Bluff
- 5349 Deep Blue Ln
- 5417 Ansley Trail
- 5456 Rising Tide
- 5411 Overland Trail
- 8157 Governors Walk
- 4615 Battery Range
- 8463 Athens Way
- 4618 Battery Range
- 4613 Battery Range
- 8461 Athens Way
- 8465 Athens Way
- 4616 Battery Range
- 4611 Battery Range
- 8462 Athens Way
- 4614 Battery Range
- 8469 Athens Way
- 4610 Moss Ct
- 4604 Moss Ct
- 4608 Moss Ct
- 5361 Tidewater Dr
- 5357 Tidewater Dr
- 4609 Battery Range
- 4612 Battery Range
- 8471 Athens Way
- 8466 Athens Way