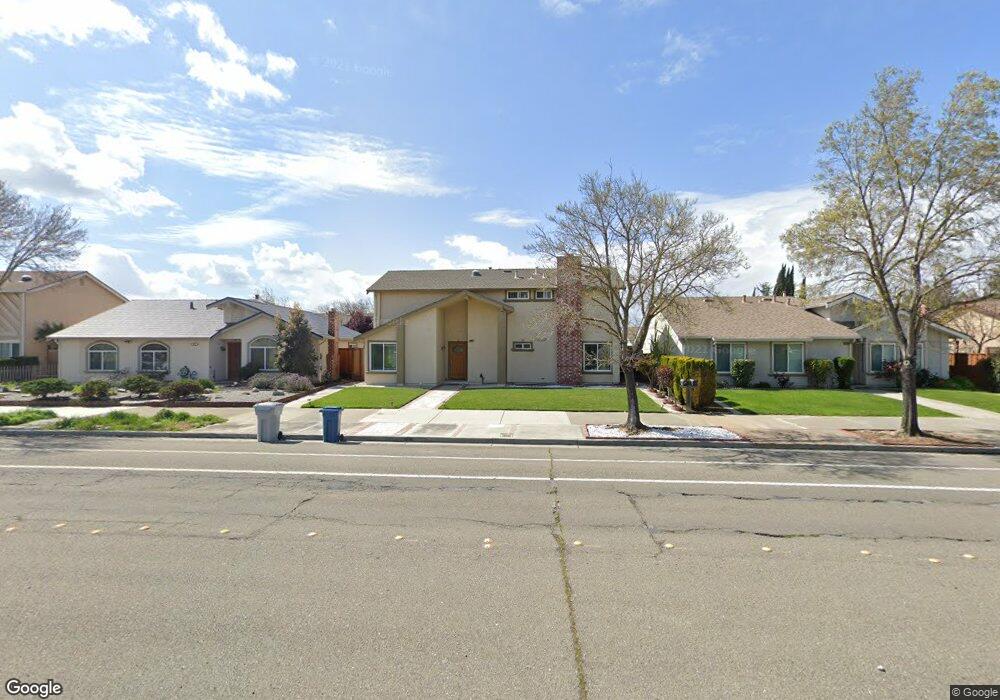
4619 Deep Creek Rd Fremont, CA 94555
Ardenwood NeighborhoodEstimated Value: $1,609,264 - $2,063,000
4
Beds
3
Baths
1,841
Sq Ft
$1,026/Sq Ft
Est. Value
About This Home
This home is located at 4619 Deep Creek Rd, Fremont, CA 94555 and is currently estimated at $1,888,566, approximately $1,025 per square foot. 4619 Deep Creek Rd is a home located in Alameda County with nearby schools including Ardenwood Elementary, Thornton Middle School, and American High School.
Ownership History
Date
Name
Owned For
Owner Type
Purchase Details
Closed on
Jun 30, 2020
Sold by
Vyas Kunal Ashokbhai and Vakil Anuradha Sunil
Bought by
Vyas Kunal Ashokbhai and Vakil Anuradha Sunil
Current Estimated Value
Purchase Details
Closed on
Mar 29, 2012
Sold by
Vyas Kunal A
Bought by
Vyas Kunal A and Vakil Anuradha
Home Financials for this Owner
Home Financials are based on the most recent Mortgage that was taken out on this home.
Original Mortgage
$417,000
Outstanding Balance
$286,039
Interest Rate
3.84%
Mortgage Type
New Conventional
Estimated Equity
$1,602,527
Purchase Details
Closed on
Mar 21, 2012
Sold by
Vakil Anuradha
Bought by
Vyas Kunal A
Home Financials for this Owner
Home Financials are based on the most recent Mortgage that was taken out on this home.
Original Mortgage
$417,000
Outstanding Balance
$286,039
Interest Rate
3.84%
Mortgage Type
New Conventional
Estimated Equity
$1,602,527
Purchase Details
Closed on
Mar 4, 2010
Sold by
Singh Gurvinder and Singh Inderpreet K
Bought by
Singh Inderpreet K and Singh Gurvinder
Home Financials for this Owner
Home Financials are based on the most recent Mortgage that was taken out on this home.
Original Mortgage
$332,600
Interest Rate
3.87%
Mortgage Type
New Conventional
Purchase Details
Closed on
Sep 20, 2002
Sold by
Singh Gurvinder and Singh Inderpreet K
Bought by
Singh Gurvinder and Singh Inderpreet K
Home Financials for this Owner
Home Financials are based on the most recent Mortgage that was taken out on this home.
Original Mortgage
$190,000
Interest Rate
6.17%
Mortgage Type
Balloon
Purchase Details
Closed on
Apr 23, 1998
Sold by
Singh Gurvinder
Bought by
Singh Gurvinder and Singh Inderpreet K
Home Financials for this Owner
Home Financials are based on the most recent Mortgage that was taken out on this home.
Original Mortgage
$196,000
Interest Rate
7.06%
Purchase Details
Closed on
May 21, 1997
Sold by
Singh Inderpreet K
Bought by
Singh Gurvinder
Home Financials for this Owner
Home Financials are based on the most recent Mortgage that was taken out on this home.
Original Mortgage
$197,600
Interest Rate
6.75%
Purchase Details
Closed on
May 6, 1997
Sold by
Joshi Parveen K and Joshi Nishi
Bought by
Singh Gurvinder and Singh Inderpreet
Home Financials for this Owner
Home Financials are based on the most recent Mortgage that was taken out on this home.
Original Mortgage
$197,600
Interest Rate
6.75%
Purchase Details
Closed on
Mar 9, 1994
Sold by
Alcasid Arturo L and Alcasid Leticia V
Bought by
Joshi Parveen K and Joshi Nishi
Create a Home Valuation Report for This Property
The Home Valuation Report is an in-depth analysis detailing your home's value as well as a comparison with similar homes in the area
Home Values in the Area
Average Home Value in this Area
Purchase History
| Date | Buyer | Sale Price | Title Company |
|---|---|---|---|
| Vyas Kunal Ashokbhai | -- | None Available | |
| Vyas Kunal A | -- | Old Republic Title Company | |
| Vyas Kunal A | -- | Old Republic Title Company | |
| Vyas Kunal A | $656,000 | Old Republic Title Company | |
| Singh Inderpreet K | -- | Fidelity National Title Co | |
| Singh Gurvinder | -- | Alliance Title Company | |
| Singh Gurvinder | -- | North American Title Co | |
| Singh Gurvinder | -- | American Title Co | |
| Singh Gurvinder | $247,000 | North American Title Co | |
| Joshi Parveen K | $233,000 | North American Title |
Source: Public Records
Mortgage History
| Date | Status | Borrower | Loan Amount |
|---|---|---|---|
| Open | Vyas Kunal A | $417,000 | |
| Previous Owner | Singh Inderpreet K | $332,600 | |
| Previous Owner | Singh Gurvinder | $190,000 | |
| Previous Owner | Singh Gurvinder | $196,000 | |
| Previous Owner | Singh Gurvinder | $197,600 | |
| Previous Owner | Singh Gurvinder | $197,600 |
Source: Public Records
Tax History Compared to Growth
Tax History
| Year | Tax Paid | Tax Assessment Tax Assessment Total Assessment is a certain percentage of the fair market value that is determined by local assessors to be the total taxable value of land and additions on the property. | Land | Improvement |
|---|---|---|---|---|
| 2025 | $9,892 | $823,928 | $247,178 | $576,750 |
| 2024 | $9,892 | $800,778 | $242,333 | $565,445 |
| 2023 | $9,626 | $791,942 | $237,582 | $554,360 |
| 2022 | $9,500 | $769,414 | $232,924 | $543,490 |
| 2021 | $9,266 | $754,195 | $228,358 | $532,837 |
| 2020 | $9,289 | $753,395 | $226,018 | $527,377 |
| 2019 | $9,182 | $738,628 | $221,588 | $517,040 |
| 2018 | $9,002 | $724,151 | $217,245 | $506,906 |
| 2017 | $8,776 | $709,955 | $212,986 | $496,969 |
| 2016 | $8,626 | $696,034 | $208,810 | $487,224 |
| 2015 | $8,511 | $685,584 | $205,675 | $479,909 |
| 2014 | $8,364 | $672,157 | $201,647 | $470,510 |
Source: Public Records
Map
Nearby Homes
- 4512 Macbeth Ave
- 4141 Deep Creek Rd Unit 137
- 4243 Nerissa Cir
- 4744 Touchstone Terrace
- 34102 Zaner Way
- 4272 Warbler Loop
- 32945 Regents Blvd
- 33018 Soquel St
- 5301 Shamrock Common
- 33283 Sunriver Common
- 3851 Milton Terrace
- 3691 Thrush Terrace
- 33162 Lake Pyramid St
- 3840 Springfield Common
- 34648 Musk Terrace
- 33228 Jamie Cir
- 4532 Delores Dr
- 4231 Hanford St
- 34198 Tony Terrace
- 34565 Pueblo Terrace
- 4603 Deep Creek Rd
- 4631 Deep Creek Rd
- 4650 Falstaff Ave
- 4643 Deep Creek Rd
- 4597 Deep Creek Rd
- 4660 Falstaff Ave
- 4598 Ariel Ave
- 33696 Bardolph Cir
- 4655 Deep Creek Rd
- 4670 Falstaff Ave
- 4589 Deep Creek Rd
- 4628 Ariel Ave
- 4594 Ariel Ave
- 4680 Falstaff Ave
- 4667 Deep Creek Rd
- 33688 Bardolph Cir
- 4563 Deep Creek Rd
- 4690 Falstaff Ave
- 4632 Ariel Ave
- 4586 Ariel Ave