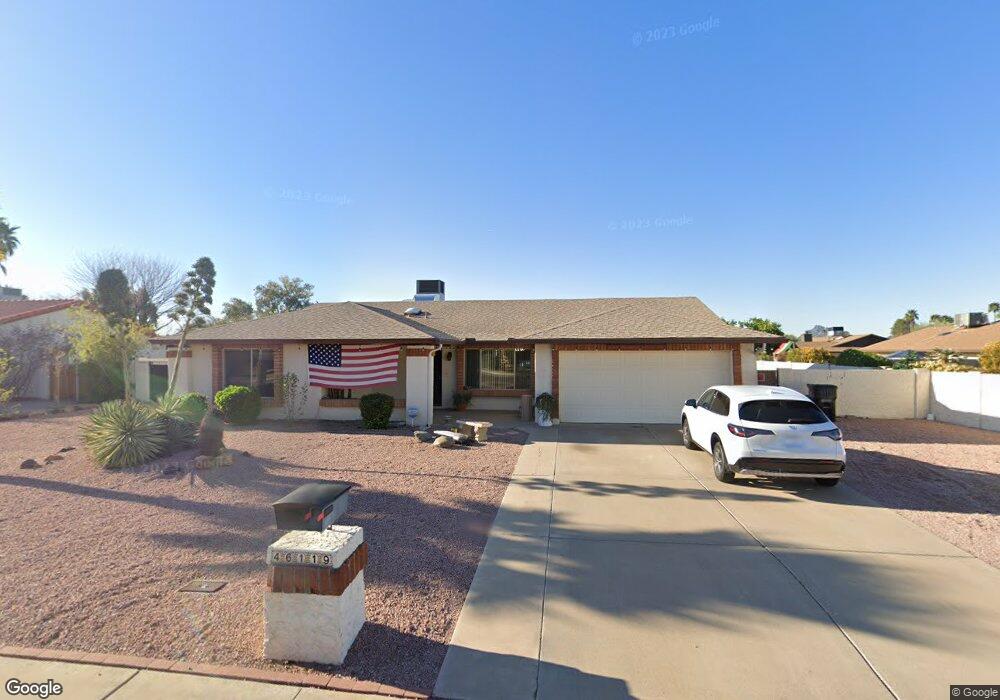
4619 E Redfield Rd Phoenix, AZ 85032
Paradise Valley Village NeighborhoodEstimated Value: $619,662 - $723,000
Studio
2
Baths
1,882
Sq Ft
$354/Sq Ft
Est. Value
About This Home
This home is located at 4619 E Redfield Rd, Phoenix, AZ 85032 and is currently estimated at $667,166, approximately $354 per square foot. 4619 E Redfield Rd is a home located in Maricopa County with nearby schools including Indian Bend Elementary School, Sunrise Middle School, and Paradise Valley High School.
Ownership History
Date
Name
Owned For
Owner Type
Purchase Details
Closed on
May 6, 2005
Sold by
Danner Mary Elizabeth
Bought by
Danner Timothy Scott
Current Estimated Value
Home Financials for this Owner
Home Financials are based on the most recent Mortgage that was taken out on this home.
Original Mortgage
$164,300
Interest Rate
5.7%
Mortgage Type
Fannie Mae Freddie Mac
Purchase Details
Closed on
May 28, 1997
Sold by
Danner Gerald L and Danner Barbara A
Bought by
Danner Timothy Scott and Danner Mary Elizabeth
Home Financials for this Owner
Home Financials are based on the most recent Mortgage that was taken out on this home.
Original Mortgage
$125,400
Interest Rate
8.13%
Mortgage Type
New Conventional
Purchase Details
Closed on
Jul 24, 1996
Sold by
Danner Gerald L and Danner Barbara A
Bought by
Danner Gerald L and Danner Barbara A
Create a Home Valuation Report for This Property
The Home Valuation Report is an in-depth analysis detailing your home's value as well as a comparison with similar homes in the area
Home Values in the Area
Average Home Value in this Area
Purchase History
| Date | Buyer | Sale Price | Title Company |
|---|---|---|---|
| Danner Timothy Scott | -- | Transnation Title | |
| Danner Timothy Scott | $132,000 | Grand Canyon Title Agency In | |
| Danner Gerald L | -- | -- |
Source: Public Records
Mortgage History
| Date | Status | Borrower | Loan Amount |
|---|---|---|---|
| Previous Owner | Danner Timothy Scott | $164,300 | |
| Previous Owner | Danner Timothy Scott | $125,400 |
Source: Public Records
Tax History
| Year | Tax Paid | Tax Assessment Tax Assessment Total Assessment is a certain percentage of the fair market value that is determined by local assessors to be the total taxable value of land and additions on the property. | Land | Improvement |
|---|---|---|---|---|
| 2025 | $2,727 | $32,668 | -- | -- |
| 2024 | $3,184 | $31,112 | -- | -- |
| 2023 | $3,184 | $46,070 | $9,210 | $36,860 |
| 2022 | $3,152 | $35,230 | $7,040 | $28,190 |
| 2021 | $3,161 | $31,610 | $6,320 | $25,290 |
| 2020 | $3,063 | $29,870 | $5,970 | $23,900 |
| 2019 | $2,631 | $28,600 | $5,720 | $22,880 |
| 2018 | $2,535 | $26,930 | $5,380 | $21,550 |
| 2017 | $2,421 | $25,610 | $5,120 | $20,490 |
| 2016 | $2,383 | $24,460 | $4,890 | $19,570 |
| 2015 | $2,211 | $23,630 | $4,720 | $18,910 |
Source: Public Records
Map
Nearby Homes
- 4617 E Acoma Dr
- 4748 E Redfield Rd
- 4350 E Winchcomb Dr
- 14243 N 49th St
- 14811 N 44th Place
- 4316 E Ludlow Dr
- 13829 N 43rd St
- 13813 N 43rd St
- 14830 N 44th Place
- 13805 N 43rd St
- 13818 N 43rd St
- 4901 E Ludlow Dr
- 4302 E Acoma Dr
- 4932 E Evans Dr
- 4829 E Voltaire Ave
- 4209 E Acoma Dr
- 4209 E Everett Dr
- 4931 E Sharon Dr
- 14043 N 41st St
- 15014 N 48th Place
- 4625 E Redfield Rd
- 14023 N 46th St
- 4620 E Sheena Dr
- 14017 N 46th St
- 4618 E Redfield Rd
- 14011 N 46th St
- 4633 E Redfield Rd
- 4626 E Redfield Rd
- 4626 E Sheena Dr
- 4610 E Redfield Rd
- 4612 E Sheena Dr
- 14003 N 46th St
- 4634 E Redfield Rd
- 4541 E Redfield Rd
- 4602 E Redfield Rd
- 14202 N 46th Place
- 4632 E Sheena Dr
- 4617 E Hearn Rd
- 14016 N 46th St
- 14022 N 47th St
Your Personal Tour Guide
Ask me questions while you tour the home.